ESA Observing the Earth 
zdroje zpráv:
Earth from Space: Strait of Gibraltar
12.3.2021 10:00
The Strait of Gibraltar is featured in this false-colour image captured by the Copernicus Sentinel-2 mission.
Gravity mission still unearthing hidden secrets
11.3.2021 14:40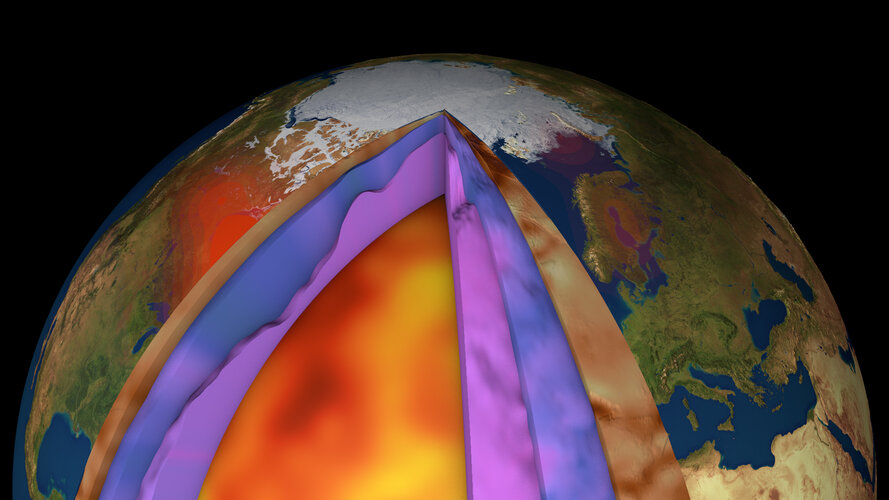
Despite ESA’s GOCE mission ending over seven years ago, scientists continue to use this remarkable satellite’s gravity data to delve deep and unearth secrets about our planet. Recent research shows how scientists have combined GOCE data with measurements taken at the surface to generate a new model of Earth’s crust and upper mantle. This is the first time such a model has been created this way – and it is shedding new light on processes of plate tectonics, which, in turn, are related to phenomena such as earthquakes and volcanic eruptions.
Antarctica’s magnetic link to ancient neighbours
9.3.2021 14:47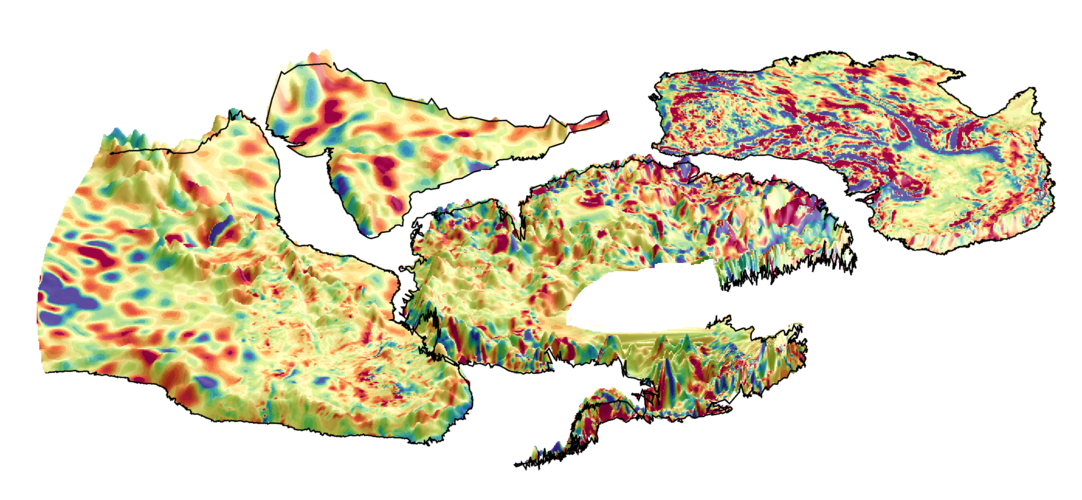
For the first time, an international team of scientists has used magnetic data from ESA’s Swarm satellite mission together with aeromagnetic data to help reveal the mysteries of the geology hidden beneath Antarctica’s kilometres-thick ice sheets, and link Antarctica better to its former neighbours.
Contract signed to build Arctic weather satellite
9.3.2021 9:35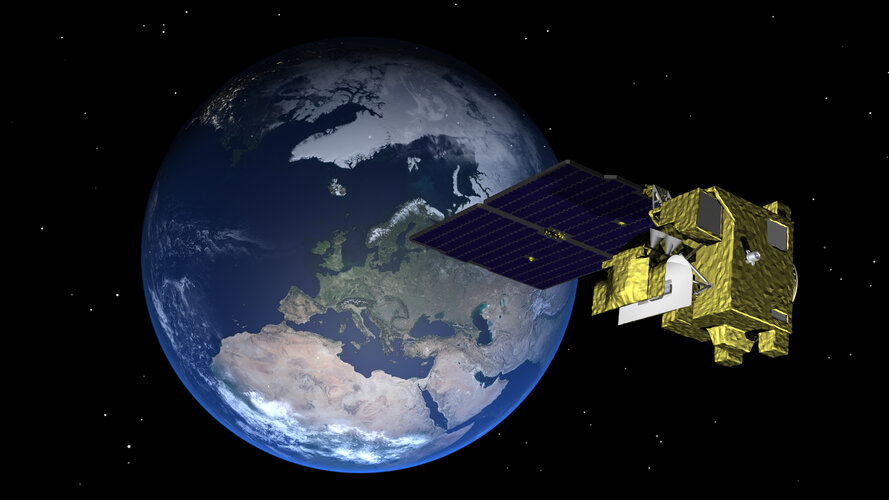
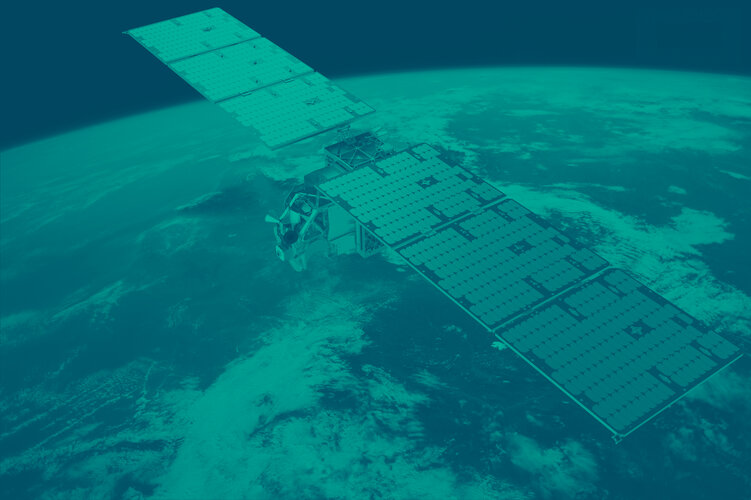
With the need for satellite data to be received more frequently for faster weather forecasting updates in the Arctic, ESA has signed a contract with OHB Sweden to a build prototype satellite for the Arctic Weather Satellite mission.
Contract signed to build Arctic weather satellite
9.3.2021 9:35
With the need for satellite data to be received more frequently for faster weather forecasting updates in the Arctic, ESA has signed a contract with OHB Sweden to a build prototype satellite for the Arctic Weather Satellite mission.
Earth from Space: Galápagos Islands
5.3.2021 10:00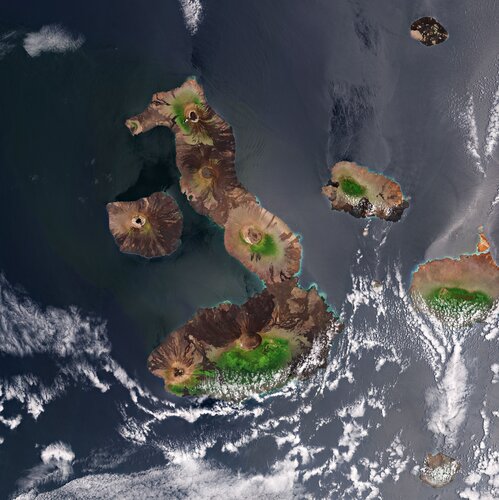
The Copernicus Sentinel-2 mission takes us over the Galápagos Islands – a volcanic archipelago situated some 1000 km west of Ecuador in the Pacific Ocean.
Earth from Space: Galápagos Islands
5.3.2021 10:00
The Copernicus Sentinel-2 mission takes us over the Galápagos Islands – a volcanic archipelago situated some 1000 km west of Ecuador in the Pacific Ocean.
Monitoring methane emissions from gas pipelines
4.3.2021 10:00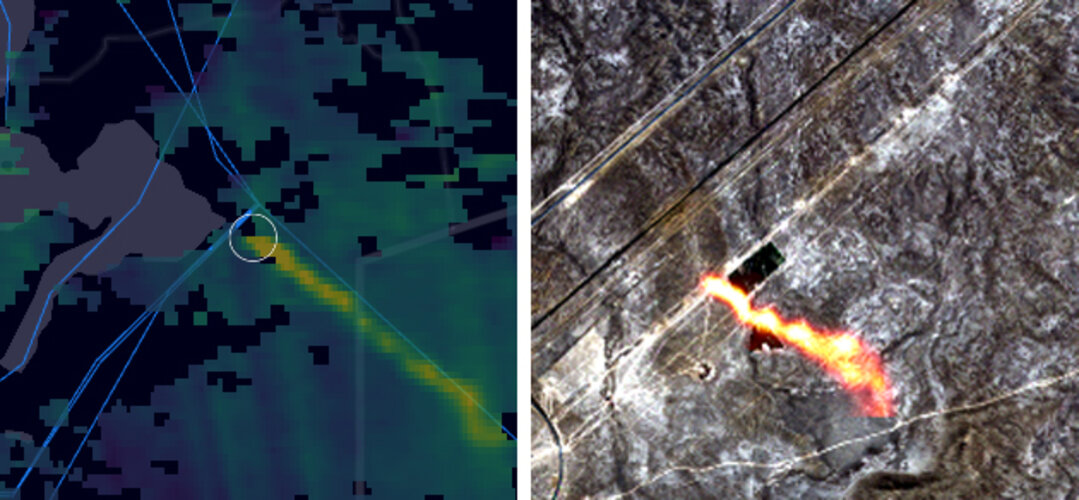
For the first time, scientists, using satellite data from the Copernicus Sentinel missions, are now able to detect individual methane plumes leaking from natural gas pipelines around the globe.
Space in response to COVID-19
3.3.2021 9:00
Do you have fresh ideas on how Earth observation data can contribute to monitoring the effects brought on by the COVID-19 pandemic? If so, ESA and the European Commission have launched a new series of monthly challenges asking for innovative solutions on how satellite data can be used to help better understand the effects of the coronavirus on society, economy and the environment.
Giant iceberg breaks off Brunt Ice Shelf in Antarctica
2.3.2021 10:00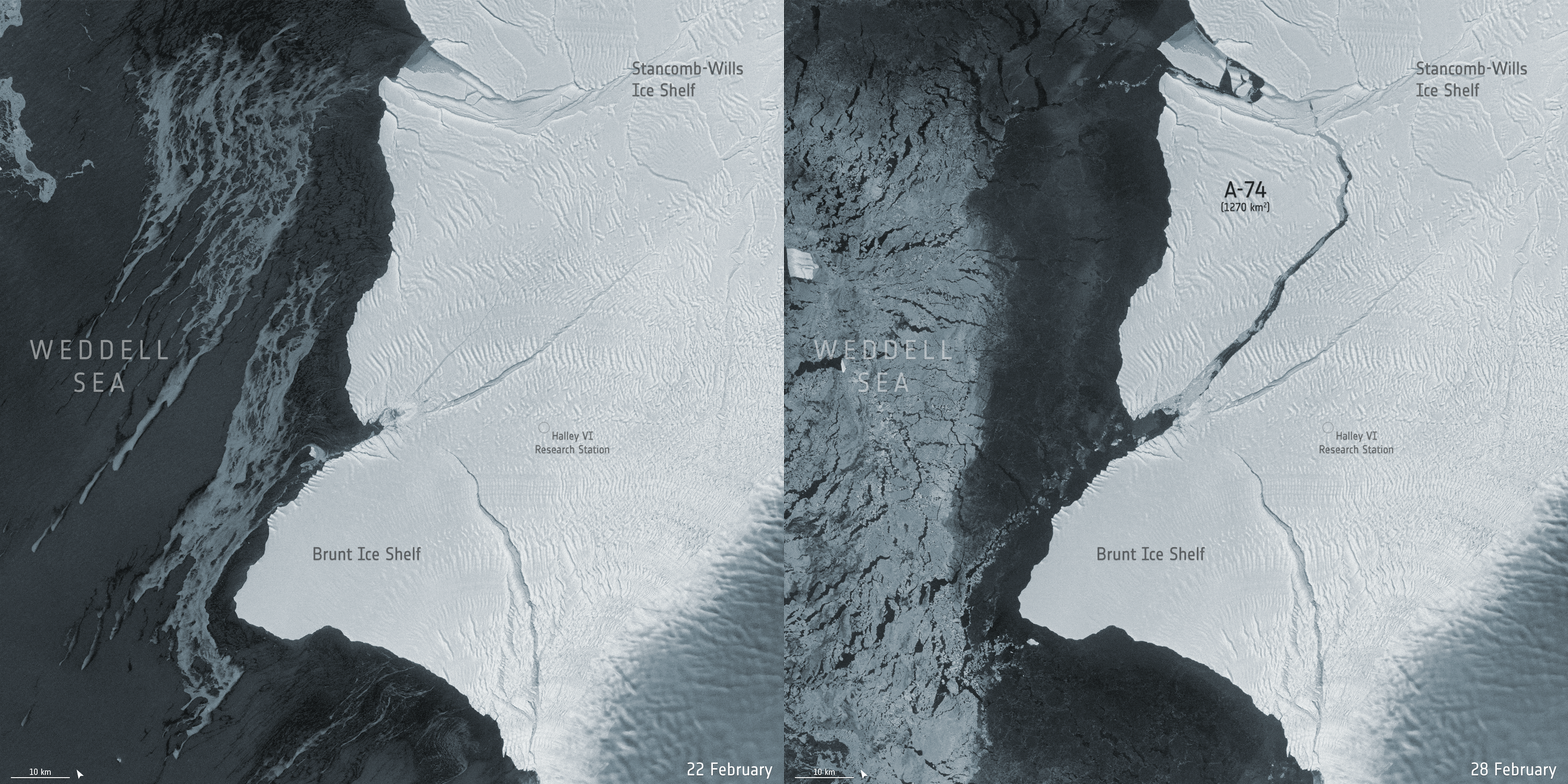 Image:
New Copernicus Sentinel-1 radar images show a giant iceberg breaking off from the northern section of Antarctica’s Brunt Ice Shelf
Giant iceberg breaks off Brunt Ice Shelf in Antarctica
2.3.2021 10:00 Image:
New Copernicus Sentinel-1 radar images show a giant iceberg breaking off from the northern section of Antarctica’s Brunt Ice Shelf
Earth from Space: Vancouver
26.2.2021 10:00
The Copernicus Sentinel-2 mission takes us over Vancouver – the third largest city in Canada.
Earth from Space: Vancouver
26.2.2021 10:00
The Copernicus Sentinel-2 mission takes us over Vancouver – the third largest city in Canada.
ESA moves forward with Harmony
23.2.2021 16:40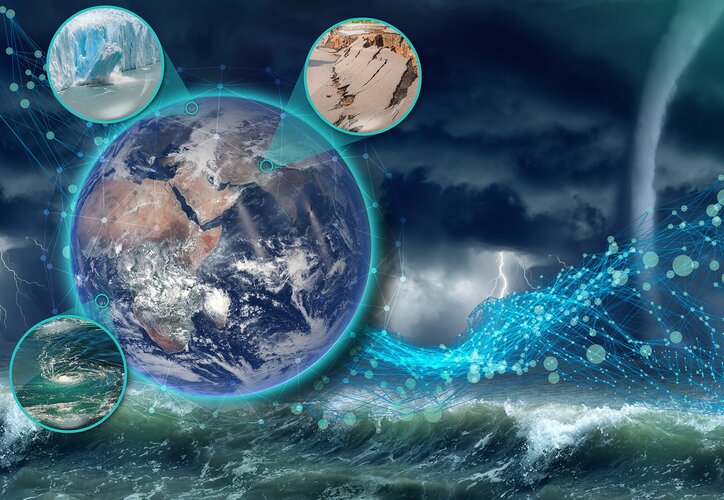
Following the selection of three Earth Explorer candidate missions to enter a first feasibility study in September 2018, ESA has chosen one of the candidates, Harmony, to move to the next phase of development. Harmony is envisaged as a mission with two satellites that orbit in formation with one of the Copernicus Sentinel-1 satellites to address key scientific questions related to ocean, ice and land dynamics.
ESA moves forward with Harmony
23.2.2021 16:40
Following the selection of three Earth Explorer candidate missions to enter a first feasibility study in September 2018, ESA has chosen one of the candidates, Harmony, to move to the next phase of development. Harmony is envisaged as a mission with two satellites that orbit in formation with one of the Copernicus Sentinel-1 satellites to address key scientific questions related to ocean, ice and land dynamics.
Getz on the run
23.2.2021 11:11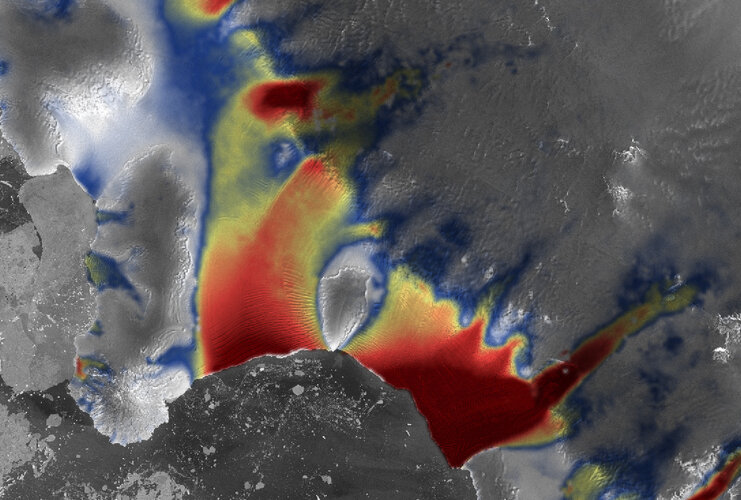
Using a 25-year record of satellite observations over the Getz region in West Antarctica, scientists have discovered that the pace at which glaciers flow towards the ocean is accelerating. This new research, which includes data from the Copernicus Sentinel-1 mission and ESA’s CryoSat mission, will help determine if these glaciers could collapse in the next few decades and how this would affect future global sea-level rise.
Satellite radar interferometry effective for mapping crops
19.2.2021 15:38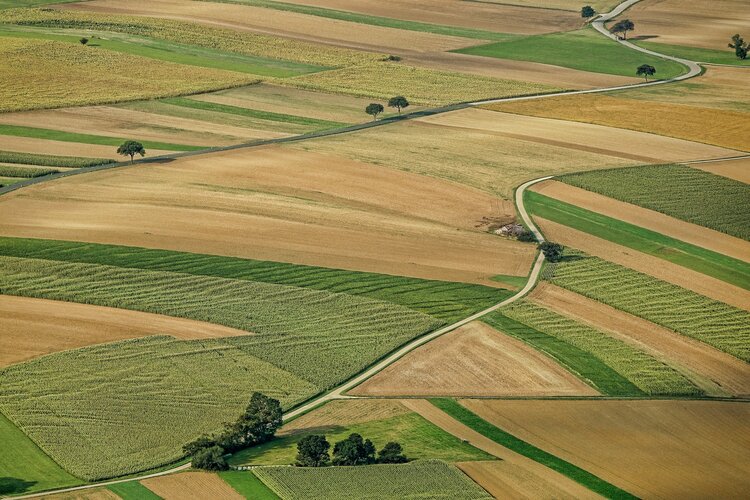
Traditionally, optical, or ‘camera-like’, satellite images are used to map different crops from space, but a recent study shows that Copernicus Sentinel-1 radar data along with interferometric processing can make crop-type mapping even better. This, in turn, will help improve crop-yield forecasts, production statistics, drought and storm damage assessments, and more.
Etna erupts
19.2.2021 13:42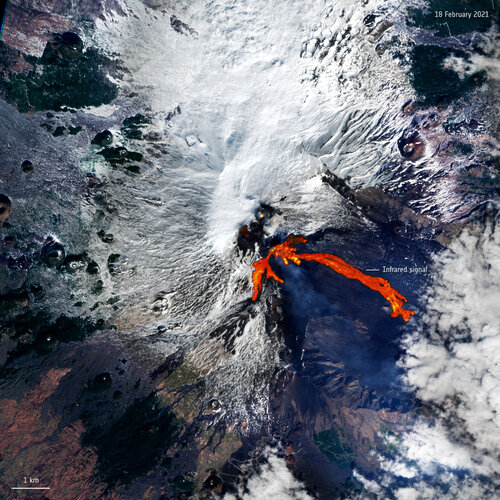 Image:
Italy’s Mount Etna, one of the world’s most active volcanoes, has erupted twice in less than 48 hours, spewing a fountain of lava and ash into the sky. This Copernicus Sentinel-2 image has been processed to show the lava flow in bright red.
Earth from Space: Lusaka, Zambia
19.2.2021 10:00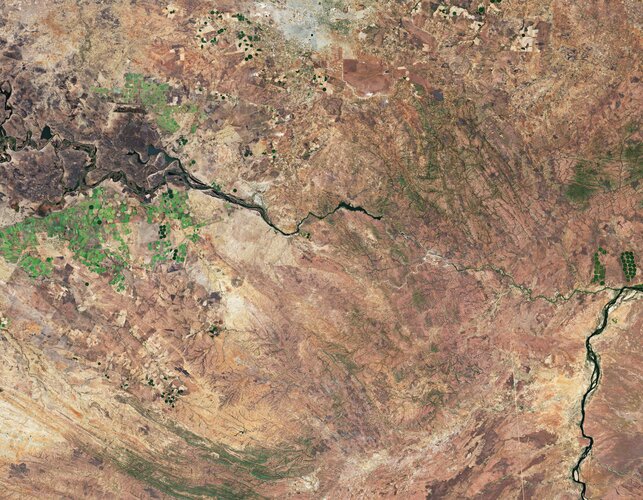
The Copernicus Sentinel-2 mission takes us over Lusaka – the capital and largest city of Zambia.
Earth from Space: Lusaka, Zambia
19.2.2021 10:00
The Copernicus Sentinel-2 mission takes us over Lusaka – the capital and largest city of Zambia.
ESA’s InCubed co-funds new Belgian mission
16.2.2021 16:00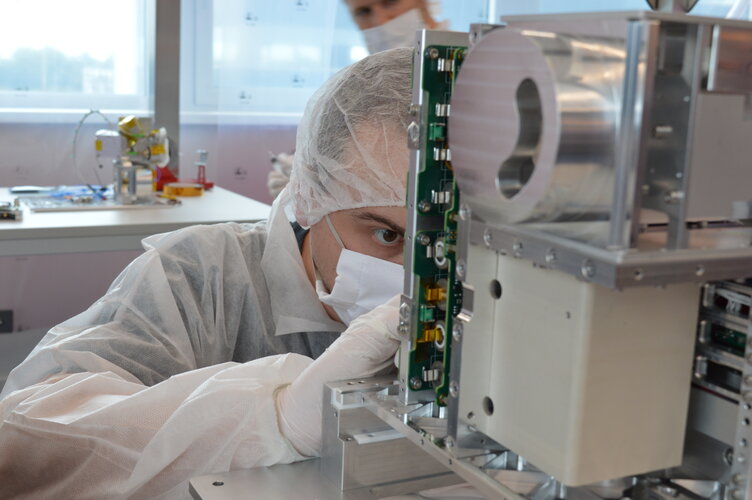 Image:
A contract signed today secures ESA InCubed co-funding towards the development of Aerospacelab’s Multispectral Companion Mission
Is Brunt on the brink?
12.2.2021 12:15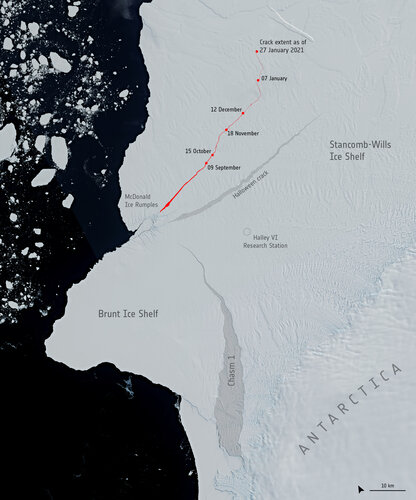
In early 2019, all eyes were fixed on the Brunt Ice Shelf in Antarctica, where a massive iceberg, around the size of Greater London, appeared poised to break off. Almost two years later, the berg is desperately clinging on, although current data indicate calving is imminent. A new crack, spotted in images captured by the Copernicus Sentinel missions, now suggests the potential for calving of multiple bergs.
Earth from Space: Valentine Island
12.2.2021 10:00
For Valentine’s Day, the Copernicus Sentinel-2 mission takes us over Valentine Island in northern Western Australia.
Earth from Space: Valentine Island
12.2.2021 10:00
For Valentine’s Day, the Copernicus Sentinel-2 mission takes us over Valentine Island in northern Western Australia.
Netherlands in white
11.2.2021 16:55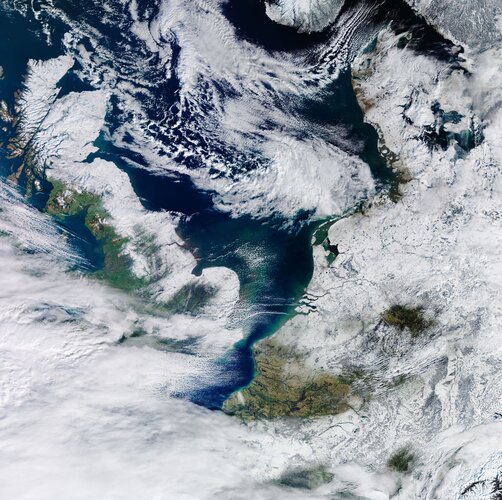 Image:
As this Copernicus Sentinel-3 image captured today shows, the Netherlands remains pretty much snow-covered thanks to days of sub-zero temperatures following the country’s first major snowstorm in a decade.
Sentinel-6 passes in-orbit tests with flying colours
8.2.2021 15:00In November 2020, the Copernicus Sentinel-6 Michael Freilich satellite was launched into orbit from the Vandenberg Air Force Base in California, US. Now, months later, the satellite has successfully passed what is known as the ‘in-orbit verification phase’, where its equipment is switched on and the instruments’ performance is checked.
Earth from Space: Japan in bloom
5.2.2021 10:00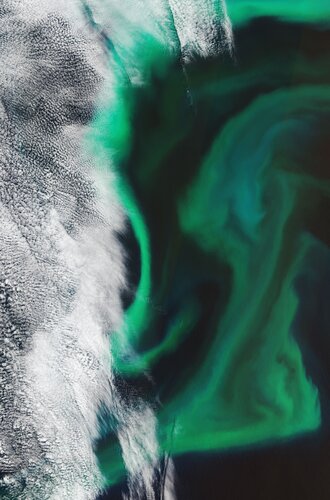
The Copernicus Sentinel-2 mission takes us over the algal blooms swirling around the Pacific Ocean, just off the coast of Japan.
Earth from Space: Japan in bloom
5.2.2021 10:00
The Copernicus Sentinel-2 mission takes us over the algal blooms swirling around the Pacific Ocean, just off the coast of Japan.
Aeolus shines a light on polar vortex
4.2.2021 11:45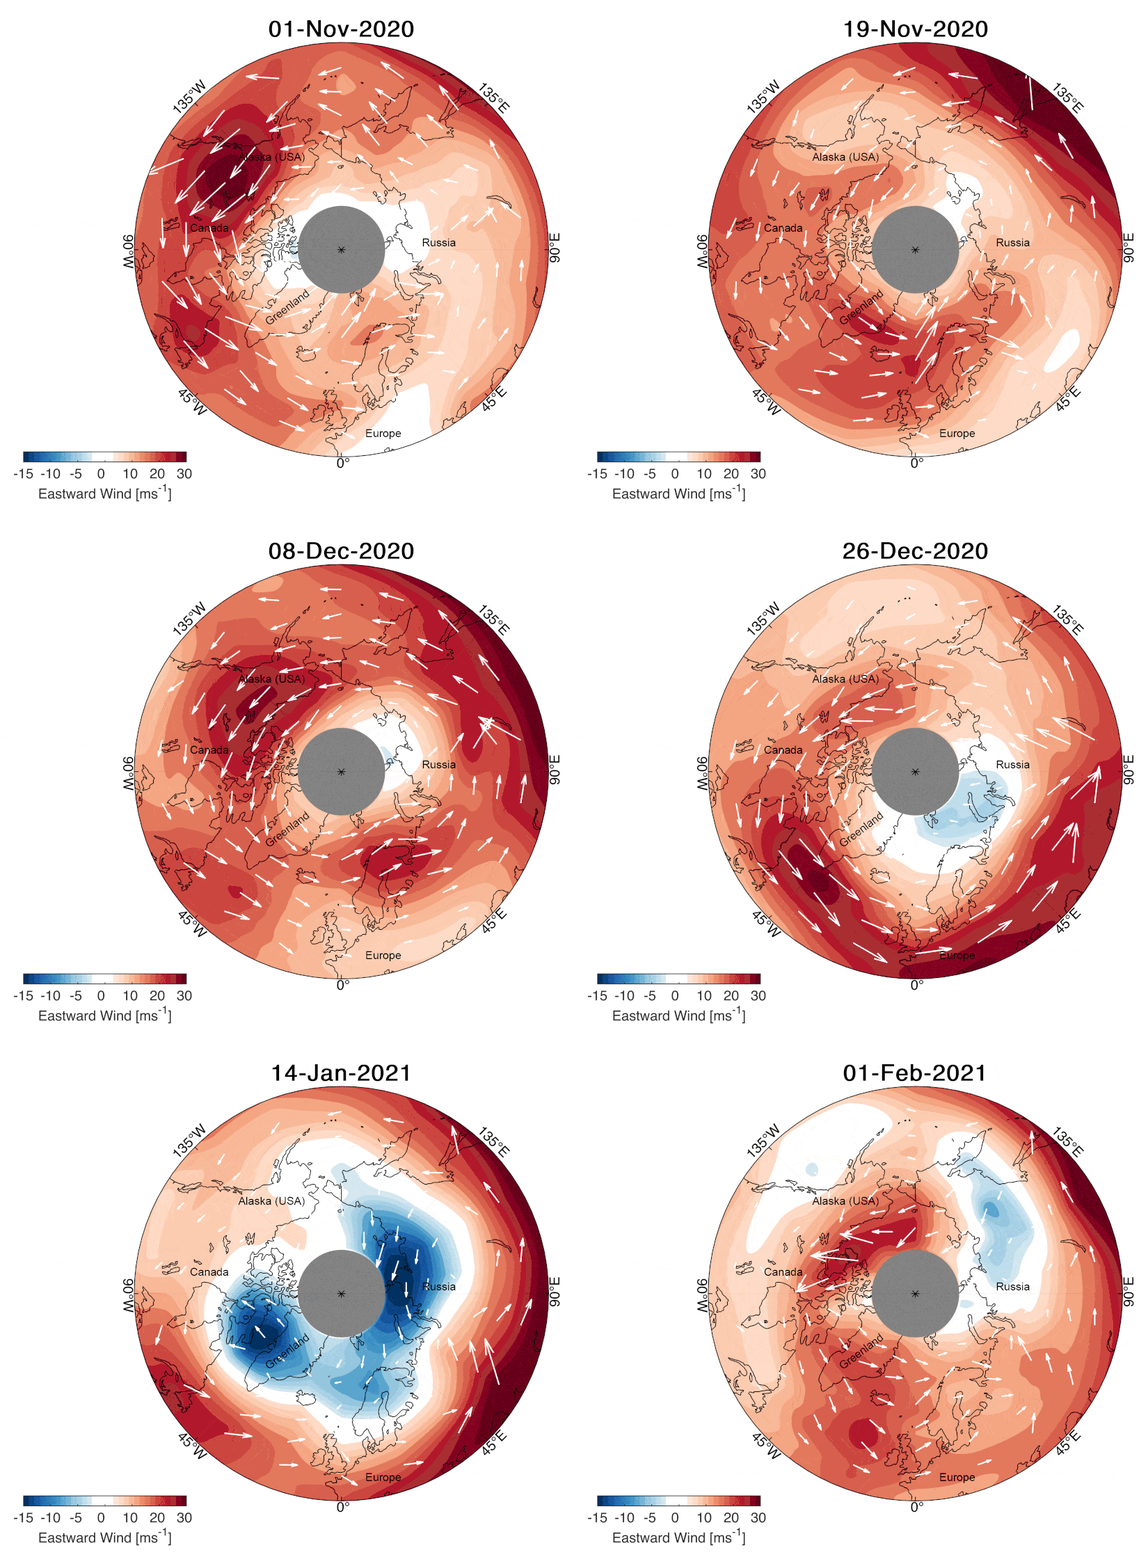
As this winter’s polar vortex currently sends extreme icy blasts of Arctic weather to some parts of the northern hemisphere such as the northeast of the US, scientists are using wind information from ESA’s Aeolus satellite to shed more light on this complex phenomenon.
Is this the end of the A-68A iceberg?
3.2.2021 12:05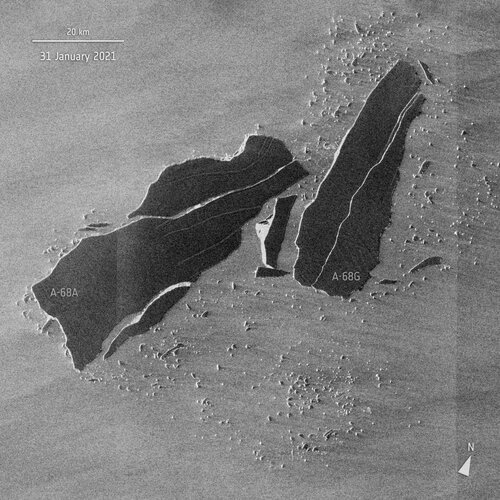
Satellite images have revealed that the once colossal A-68A iceberg has had yet another shattering experience. Several large cracks were spotted in the berg last week and it has since broken into multiple pieces. These little icebergs could indicate the end of A-68A’s environmental threat to South Georgia.
Satellite observations prove crucial in new climate science report
2.2.2021 15:15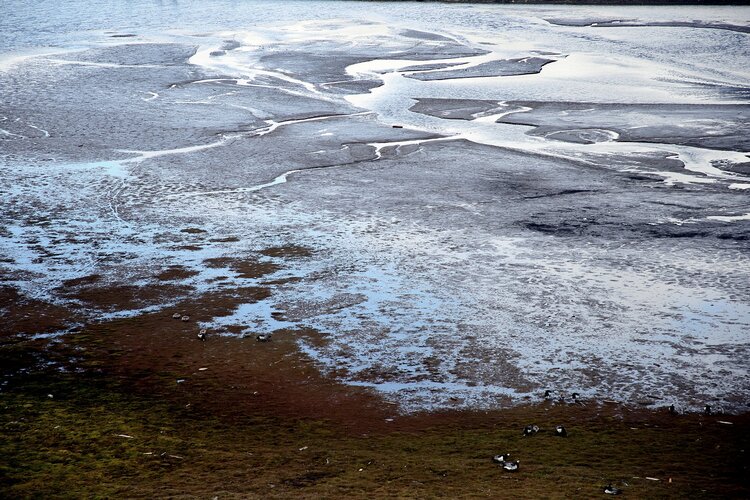
With impacts from climate change threatening major disruption to society in the coming years, leading scientists have released a compilation of the 10 most important insights on climate to help inform collective action on the ongoing climate crisis, in which satellites have played a crucial role in aiding scientific understanding.
Earth observation vital in monitoring wetland waters
2.2.2021 9:00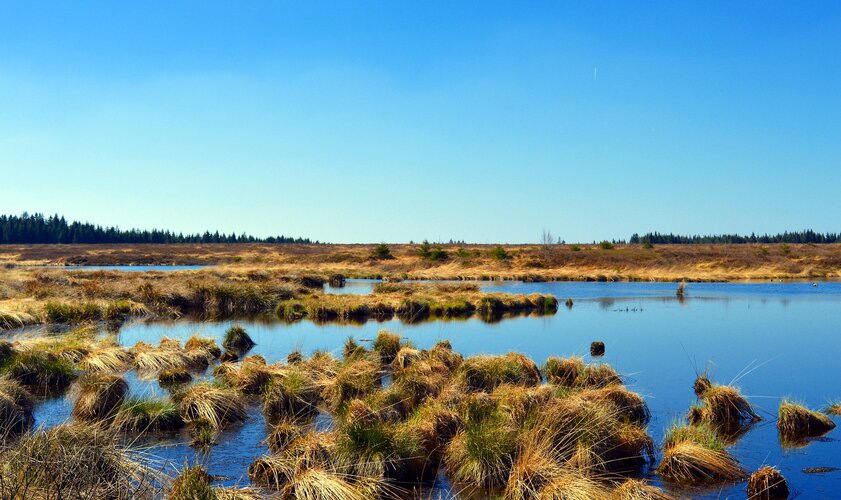
Celebrated annually on 2 February, World Wetlands Day aims to raise global awareness about the importance of wetlands for our planet. This year’s theme shines a light on wetlands as a source of freshwater and encourages actions to restore them. From their vantage point of 800 km high, Earth-observing satellites provide data and imagery on wetlands that can be used to monitor and manage these precious resources sustainably.
Earth from Space: Lake Titicaca
29.1.2021 10:00
Ahead of World Wetlands Day, the Copernicus Sentinel-2 mission takes us over Lake Titicaca – one of the largest lakes in South America.
Earth from Space: Lake Titicaca
29.1.2021 10:00
Ahead of World Wetlands Day, the Copernicus Sentinel-2 mission takes us over Lake Titicaca – one of the largest lakes in South America.
Mapped by Sentinel-1 for Vendée Globe safety
28.1.2021 9:20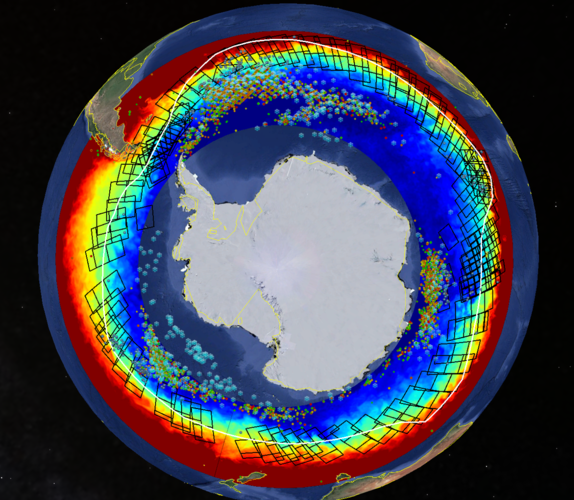 Image:
Competitors of the Vendée Globe sailing race are now nearing the finishing point, but while they were near the treacherous iceberg-infested waters of the Southern Ocean they remained relatively safe thanks to satellite observations.
New long-term dataset to analyse global fire trends
26.1.2021 15:30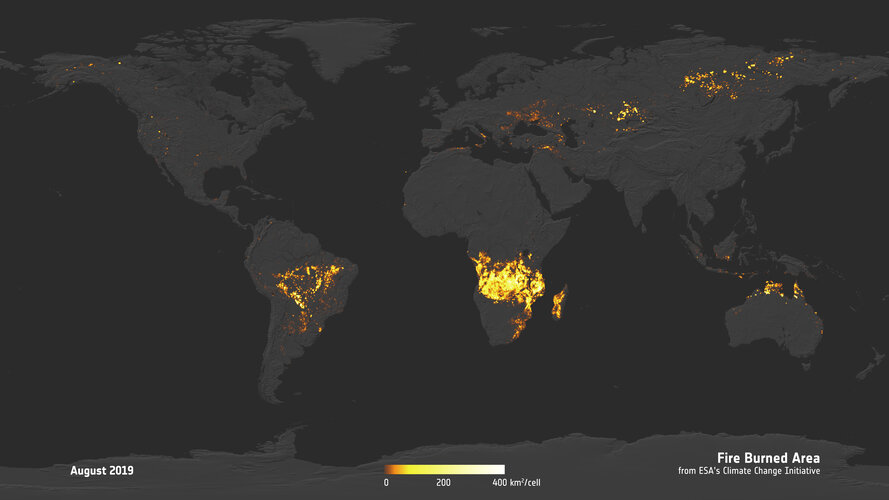
Fire affects an estimated four million square kilometres of Earth’s land each year and is responsible for releasing aerosols and greenhouse gases to the atmosphere. Understanding the influence that this has on atmospheric chemistry and representing these emissions in future climate predictions is, however, complex and remains poorly understood. To improve the situation, a team of scientists working as part of ESA’s Climate Change Initiative is using satellite observations, such as from Copernicus Sentinel-3, to gain a global view of land burned by fire.
Cloud-free crop maps foster sustainable farming
25.1.2021 13:00
The rapidly rising global population, sustainability and climate change are among the challenges the agriculture sector faces in the business of producing food. Fortunately, information from satellites can help. A new commercial service – the first in the world – cleverly combines radar data from Copernicus Sentinel-1 and optical data from Copernicus Sentinel-2 to offer daily maps of field-scale crop biomass. Importantly, these maps are completely unimpeded by cloud cover. This new service allows farmers to better monitor and assess the growth of their produce, and, ultimately, make more effective decisions.
Our world is losing ice at record rate
25.1.2021 11:45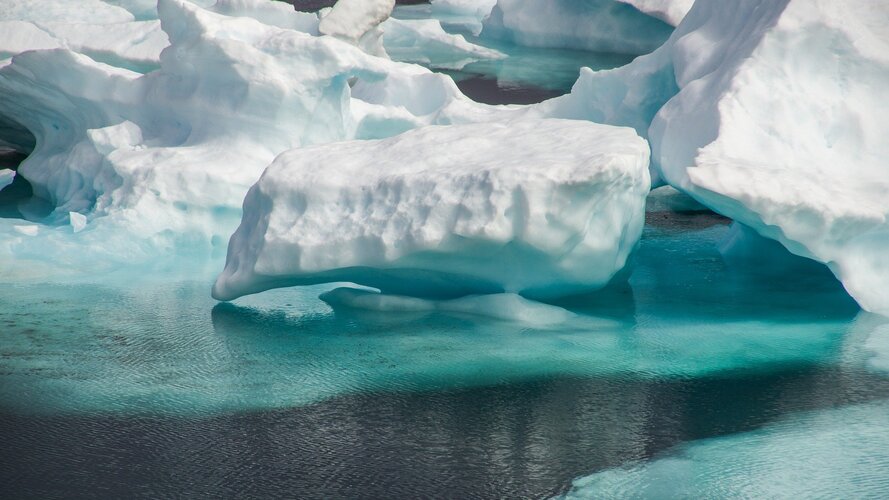
A research team – the first to carry out a survey of global ice loss using satellite data – has discovered that the rate at which ice is disappearing across the planet is speeding up. The findings also reveal that 28 trillion tonnes of ice was lost between 1994 and 2017 – equivalent to a sheet of ice 100 metres thick covering the whole of the UK.
Sardinia, Italy
22.1.2021 10:00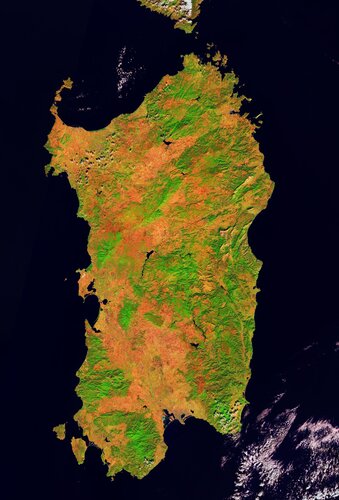 Image:
Sardinia, the second-largest island in the Mediterranean Sea, is featured in this false-colour image captured by the Copernicus Sentinel-2 mission.
Earth from Space: Sardinia
22.1.2021 10:00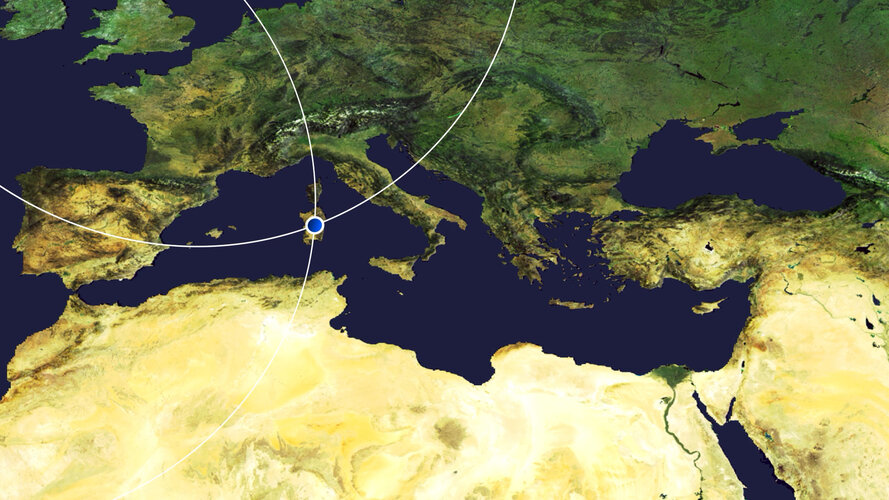 Video:
00:03:23
This week's edition of the Earth from Space programme features a Copernicus Sentinel-2 image of Sardinia, the second-largest island in the Mediterranean Sea.
See also Sardinia, Italy to download the image.
Lake heatwaves to increase due to climate change
21.1.2021 9:00
Lake heatwaves – periods of extreme warm surface water temperature in lakes – may become hotter and longer by the end of the 21st century, according to a study published in Nature, increasing the link between climate change and extreme events.
Lake heatwaves to increase due to climate change
21.1.2021 9:00
Lake heatwaves – periods of extreme warm surface water temperature in lakes – may become hotter and longer by the end of the 21st century, according to a new study published in Nature, increasing the link between climate change and extreme events.
Tanezrouft Basin
15.1.2021 10:00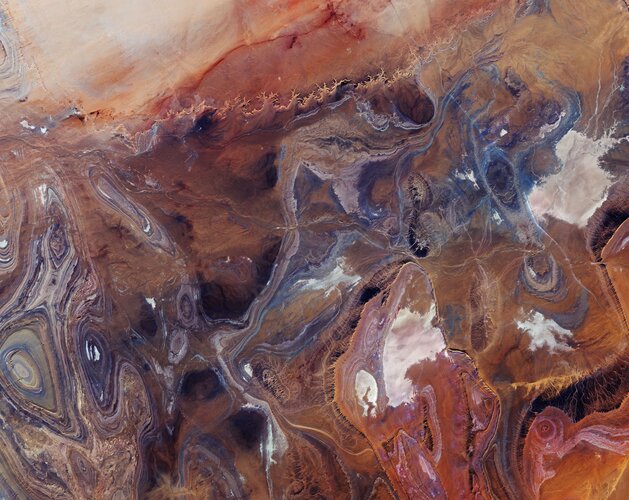 Image:
The Copernicus Sentinel-2 mission takes us over the Tanezrouft Basin – one of the most desolate parts of the Sahara Desert.
Earth from Space: Tanezrouft
15.1.2021 10:00 Video:
00:02:50
In this week's edition of the Earth from Space programme, the Copernicus Sentinel-2 mission takes us over the Tanezrouft Basin – one of the most desolate parts of the Sahara Desert.
See also Tanezrouft Basin to download the image.
Spain’s chilly blanket
13.1.2021 11:54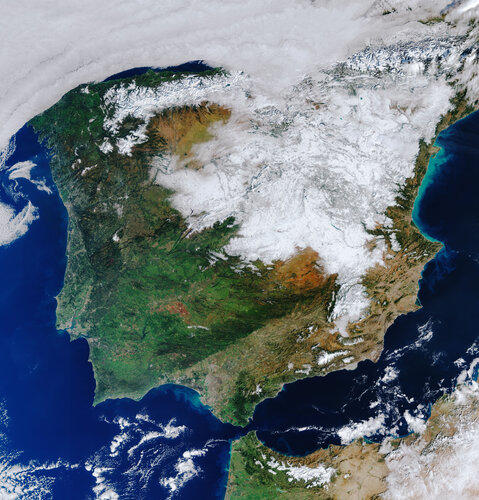 Image:
The heavy snowfall that hit Spain a few days ago still lies heavy across much of the country as this Copernicus Sentinel-3 satellite image shows.
Madrid snowbound
12.1.2021 13:35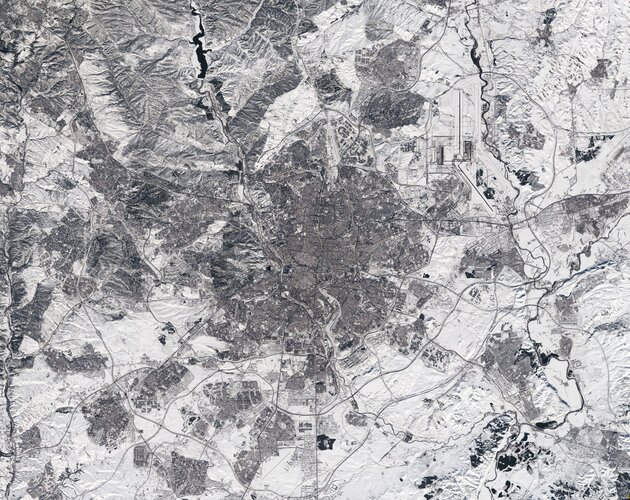 Image:
This Copernicus Sentinel-2 image of Madrid in Spain appears to have been taken in black and white. In fact, it is a true-colour image – but the heaviest snowfall in 50 years has blanketed the region, turning the landscape white.
Energy from solar wind favours the north
12.1.2021 9:40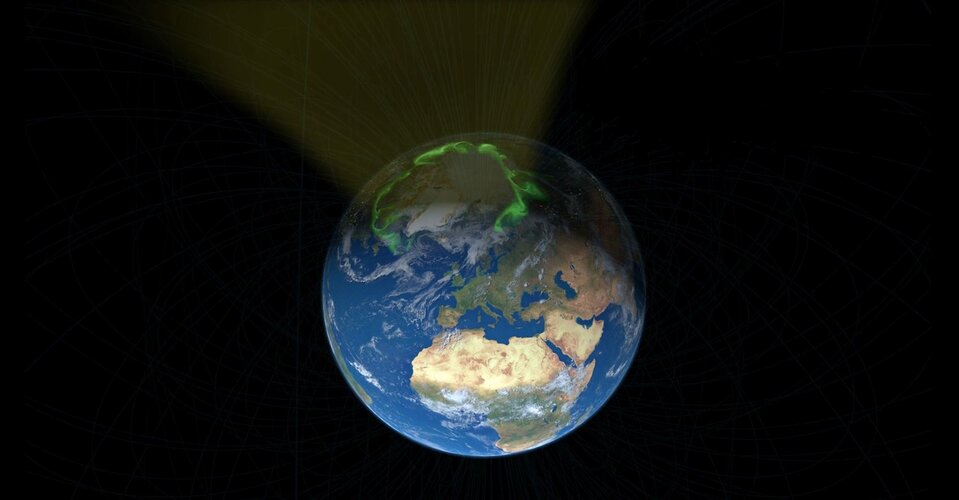
Using information from ESA’s Swarm satellite constellation, scientists have made a discovery about how energy generated by electrically-charged particles in the solar wind flows into Earth’s atmosphere – surprisingly, more of it heads towards the magnetic north pole than towards the magnetic south pole.
A-68A iceberg thinning at 2.5 cm per day
23.12.2020 16:30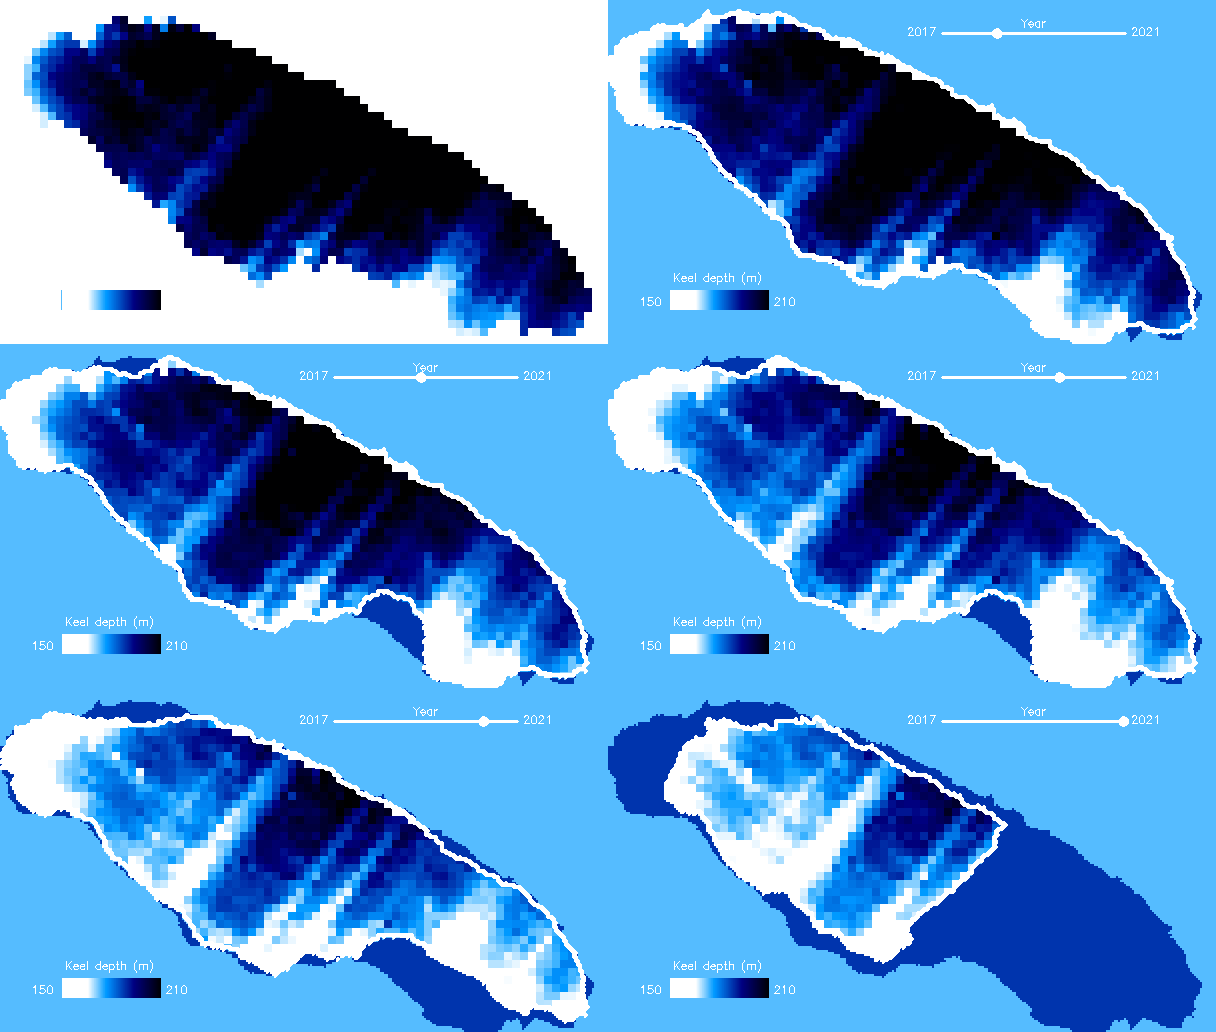
Latest images reveal that the A-68A iceberg has shattered into multiple pieces, with two large fragments of ice breaking off from the main berg and floating away in the open ocean. Scientists using satellite data have not only been monitoring the iceberg’s journey across the South Atlantic Ocean, but have been studying the iceberg’s ever-changing shape.
Giant A-68A iceberg loses chunk of ice
18.12.2020 15:10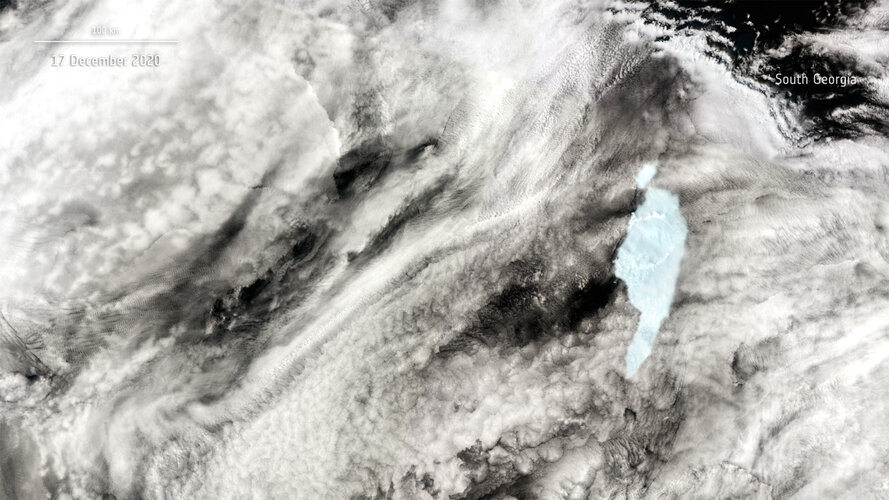
A large block of ice has broken off the northern tip of the A-68A iceberg as seen in new images captured by the Copernicus Sentinel-3 mission.
Giant A-68A iceberg loses chunk of ice
18.12.2020 15:10
A large block of ice has broken off the northern tip of the A-68A iceberg as seen in new images captured by the Copernicus Sentinel-3 mission.
Rovaniemi, Lapland
18.12.2020 10:00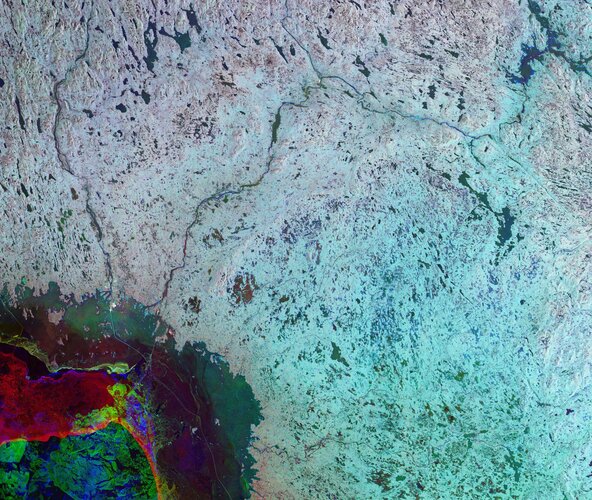 Image:
The Copernicus Sentinel-1 mission takes us over Lapland, the largest and northernmost region of Finland, just in time for Christmas.
Earth from Space: Lapland
18.12.2020 10:00 Video:
00:03:38
In this week's edition of the Earth from Space programme, the Copernicus Sentinel-1 mission takes us over Lapland, the largest and northernmost region of Finland, just in time for Christmas.
See also Rovaniemi, Lapland to download the image.
Loss of Vega flight VV17: Independent Enquiry Commission announces conclusions
17.12.2020 16:51Press Release N° 33–2020
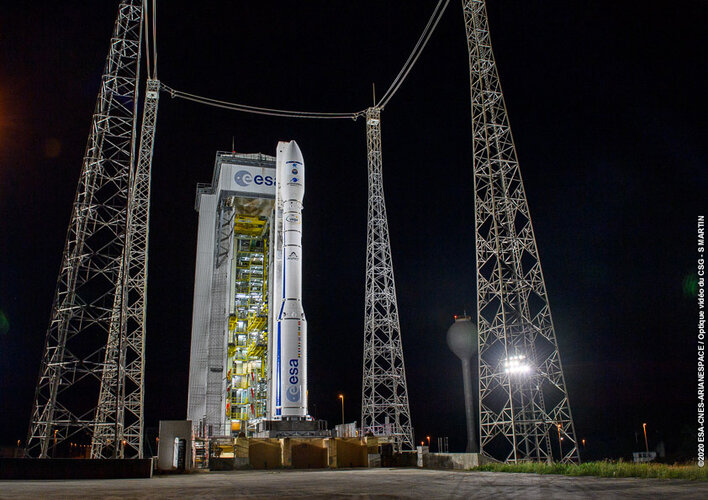
On Tuesday, November 17, Arianespace announced the loss of the Vega VV17 mission, which was carrying two payloads, SEOSAT-Ingenio, an Earth-science observation satellite for the European Space Agency (ESA), on behalf of Spain's Center for Development of Industrial Technology (CDTI), and TARANIS for France’s National Centre for Space Studies (CNES). The first three stages functioned nominally until the ignition of the AVUM upper stage, eight minutes after liftoff. At that time, a degraded trajectory was detected, followed by a loss of control of the vehicle and the subsequent loss of the mission.
Mountains of snow
17.12.2020 14:20 Image:
Heavy snowfall in the Alps has been recorded over the past weeks. The Copernicus Sentinel-3 mission captured this image of the snow-covered Alps on 14 December.
Cholera outbreaks predicted using climate data and AI
17.12.2020 9:40
Climate data taken from Earth orbiting satellites, combined with machine learning techniques, are helping to better predict outbreaks of cholera and potentially save lives.
Long-term permafrost record details Arctic thaw
16.12.2020 10:00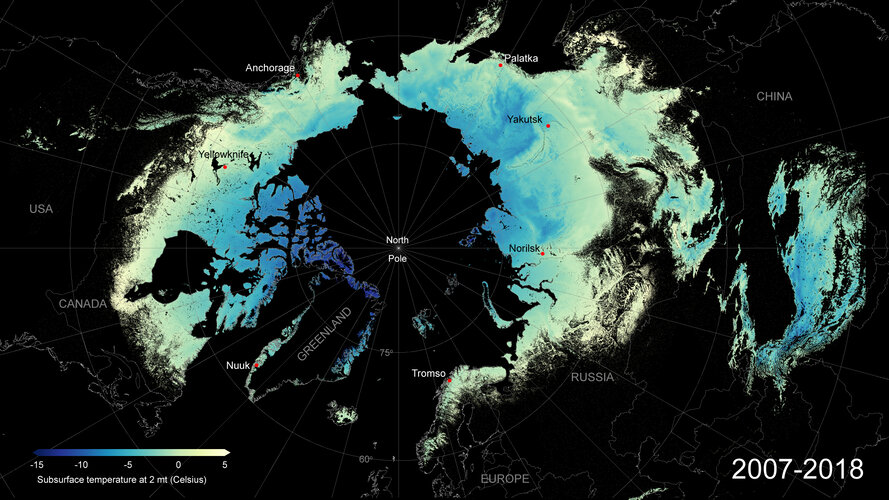
Frozen Arctic soils are set to release vast amounts of greenhouse gases to the atmosphere as they continue to thaw in coming decades. Despite concerns that this will fuel future global warming, the scale and speed of this important climate process remain uncertain. To help address this knowledge gap, ESA-funded researchers have developed and released a new permafrost dataset – the longest, satellite-derived permafrost record currently available.
CryoSat reveals surprising ebb and flow of subglacial lakes
14.12.2020 13:50
Hidden from view by ice kilometres thick, there is a vast network of lakes and streams at the base of the Antarctic ice sheet. This subsurface meltwater affects the speed with which the ice sheet flows towards the ocean. Using a decade of altimetry data from ESA’s CryoSat satellite, scientists have made an unexpected discovery about how lakes beneath Thwaites glacier have drained and recharged in quick succession. Hidden from view by ice kilometres thick, there is a vast network of lakes and streams at the base of the Antarctic ice sheet.
CryoSat reveals surprising ebb and flow of subglacial lakes
14.12.2020 13:50
Hidden from view by ice kilometres thick, there is a vast network of lakes and streams at the base of the Antarctic ice sheet. This subsurface meltwater affects the speed with which the ice sheet flows towards the ocean. Using a decade of altimetry data from ESA’s CryoSat satellite, scientists have made an unexpected discovery about how lakes beneath Thwaites glacier have drained and recharged in quick succession.
Mapping high-resolution methane emissions from space
14.12.2020 9:51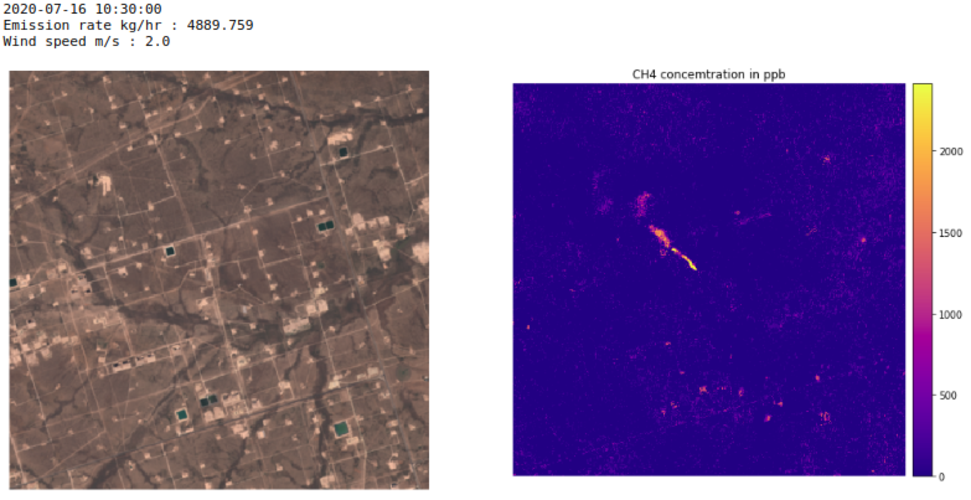
Scientists have used satellite data from the Copernicus Sentinel-2 mission, combined with the Sentinel-5P satellite, to detect individual methane emissions from space.
Iceberg on collision course with South Georgia
11.12.2020 12:00 Video:
00:02:06
The giant A-68A iceberg could strike land this month – wreaking havoc near the waters of the South Georgia Island.
Since its ‘birth’ in 2017, the iceberg has travelled thousands of kilometres from the Larsen C ice shelf, in Antarctica, and now lies around 120 km from South Georgia. If it remains on its current path, the iceberg could ground in the shallow waters offshore – threatening wildlife, including penguins and seals.
Satellite missions are being used to track the berg on its journey over the past three years. The Copernicus Sentinel-1 radar mission, with its ability to see through clouds and the dark, has been instrumental in mapping the polar regions in winter.
Video credits:
Animation: contains modified Copernicus Sentinel data (2017-18), processed by Swansea University-A. Luckman
Radar images: contains modified Copernicus Sentinel data (2020), processed by ESA, CC BY-SA 3.0 IGO
A-68A map: contains modified Copernicus Sentinel data (2020), processed by ESA; Antarctic Iceberg Tracking Database
Sentinel-1 animations: ESA/ATG Medialab
Penguins footage: Getty
Iceberg on collision course with South Georgia
11.12.2020 12:00 Video:
00:02:06
The giant A-68A iceberg could strike land this month – wreaking havoc near the waters of the South Georgia Island.
Since its ‘birth’ in 2017, the iceberg has travelled thousands of kilometres from the Larsen C ice shelf, in Antarctica, and now lies around 120 km from South Georgia. If it remains on its current path, the iceberg could ground in the shallow waters offshore – threatening wildlife, including penguins and seals.
Satellite missions are being used to track the berg on its journey over the past three years. The Copernicus Sentinel-1 radar mission, with its ability to see through clouds and the dark, has been instrumental in mapping the polar regions in winter.
Video credits:
Animation: contains modified Copernicus Sentinel data (2017-18), processed by Swansea University-A. Luckman
Radar images: contains modified Copernicus Sentinel data (2020), processed by ESA, CC BY-SA 3.0 IGO
A-68A map: contains modified Copernicus Sentinel data (2020), processed by ESA; Antarctic Iceberg Tracking Database
Sentinel-1 animations: ESA/ATG Medialab
Penguins footage: Getty
Iceberg on collision course with South Georgia
11.12.2020 12:00 Video:
00:02:06
The giant A-68A iceberg could strike land this month – wreaking havoc near the waters of the South Georgia Island.
Since its ‘birth’ in 2017, the iceberg has travelled thousands of kilometres from the Larsen C ice shelf, in Antarctica, and now lies around 120 km from South Georgia. If it remains on its current path, the iceberg could ground in the shallow waters offshore – threatening wildlife, including penguins and seals.
Satellite missions are being used to track the berg on its journey over the past three years. The Copernicus Sentinel-1 radar mission, with its ability to see through clouds and the dark, has been instrumental in mapping the polar regions in winter.
Video credits:
Animation: contains modified Copernicus Sentinel data (2017-18), processed by Swansea University-A. Luckman
Radar images: contains modified Copernicus Sentinel data (2020), processed by ESA, CC BY-SA 3.0 IGO
A-68A map: contains modified Copernicus Sentinel data (2020), processed by ESA; Antarctic Iceberg Tracking Database
Sentinel-1 animations: ESA/ATG Medialab
Penguin footage: Getty Images
Iceberg on collision course with South Georgia
11.12.2020 12:00 Video:
00:02:06
The giant A-68A iceberg could strike land this month – wreaking havoc near the waters of the South Georgia Island.
Since its ‘birth’ in 2017, the iceberg has travelled thousands of kilometres from the Larsen C ice shelf, in Antarctica, and now lies around 120 km from South Georgia. If it remains on its current path, the iceberg could ground in the shallow waters offshore – threatening wildlife, including penguins and seals.
Satellite missions are being used to track the berg on its journey over the past three years. The Copernicus Sentinel-1 radar mission, with its ability to see through clouds and the dark, has been instrumental in mapping the polar regions in winter.
Kyiv, Ukraine
11.12.2020 10:00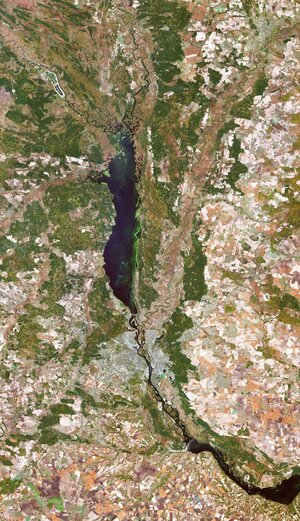 Image:
The Copernicus Sentinel-2 mission takes us over Kyiv – the capital and most populous city of Ukraine.
Earth from Space: Kyiv
11.12.2020 10:00 Video:
00:03:17
In this week's edition of the Earth from Space programme, the Copernicus Sentinel-2 mission takes us over Kyiv – the capital and most populous city of Ukraine.
See also Kyiv, Ukraine to download the image.
Reef Support wins Copernicus Masters top prize
10.12.2020 15:25
Reef Support won this year’s Copernicus Masters competition, and were honoured during the online Space Awards on 8 December as part of the European Space Week 2020. The innovative idea uses Copernicus Sentinel data and artificial intelligence to detect coral bleaching, algal blooms, sediment plumes and human debris.
Sea-level monitoring satellite first results surpass expectations
10.12.2020 10:08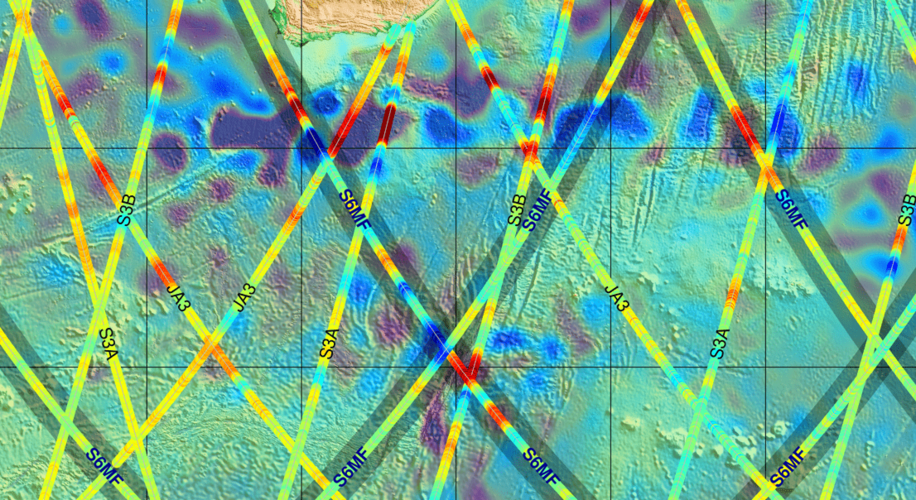
Launched less than three weeks ago, the Copernicus Sentinel-6 Michael Freilich satellite has not only returned its first data, but results also show that it is functioning far better than expected. Thanks to its new, sophisticated, altimetry technology, Sentinel-6 is poised to deliver exceptionally precise data on sea-level height to monitor the worrying trend of sea-level rise.
Places in Antarctica named in honour of ice scientists
9.12.2020 12:04
Celebrating 200 years since the discovery of the Antarctic continent, the UK Committee for Antarctic Place-Names has named 28 mountains, glaciers and bays after modern-day scientists who have advanced our understanding of this remote continent. Four of the names on the list have strong links to ESA, having either worked on the development of polar-orbiting altimetry missions such as ERS-1, ERS-2, Envisat and CryoSat, or subsequently by using their data together with other satellite missions for key polar research projects.
Monitoring European air traffic with Earth observation
7.12.2020 13:05
In early 2020, ESA launched a contest asking the general public to submit ideas on how Earth observation data can help monitor the impacts of the COVID-19 pandemic. Now, one of the winning ideas has been integrated into the ‘Rapid Action on COVID-19 with Earth observation’ dashboard – a joint initiative from ESA and the European Commission. This new idea focuses on monitoring air traffic in Europe using imagery from the Copernicus Sentinel-2 mission.
Earth from Space: Banks Peninsula
4.12.2020 10:00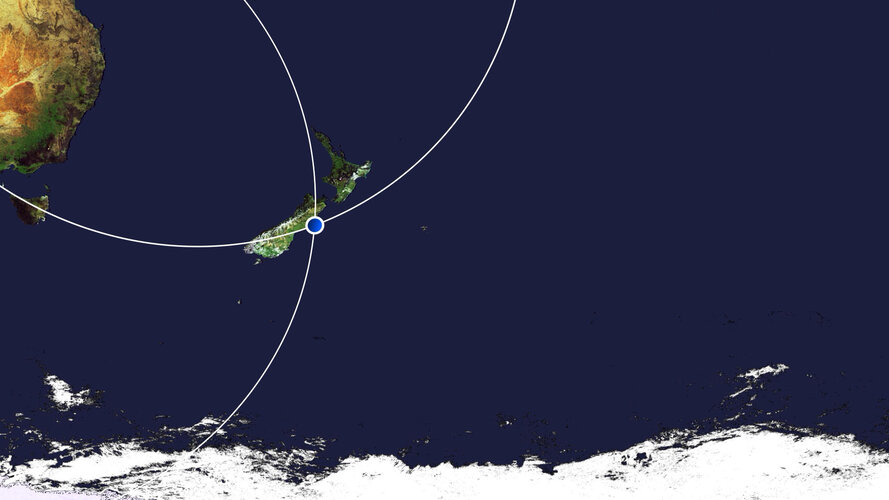 Video:
00:03:16
This week's edition of the Earth from Space programme features a Copernicus Sentinel-2 image of the Banks Peninsula on the South Island of New Zealand.
See also Banks Peninsula, New Zealand to download the image.
Banks Peninsula, New Zealand
4.12.2020 10:00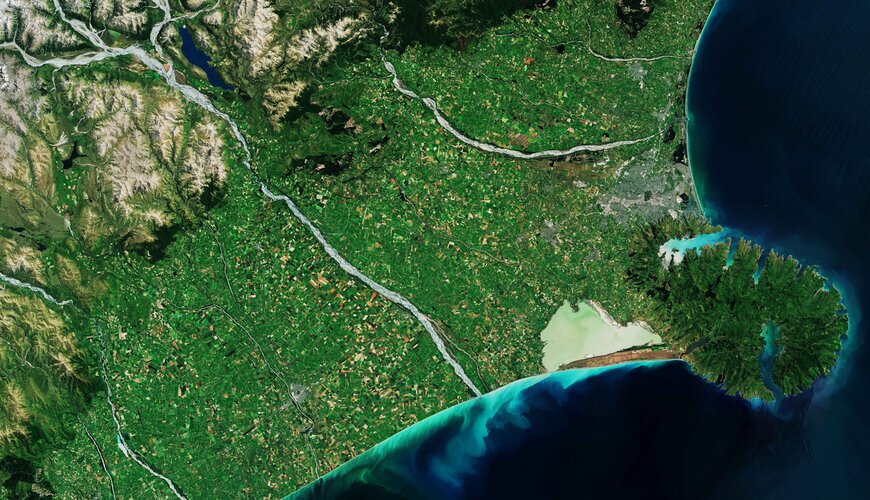 Image:
The Copernicus Sentinel-2 mission takes us over the Banks Peninsula on the South Island of New Zealand.
Contract signed for new Copernicus ROSE-L mission
3.12.2020 18:15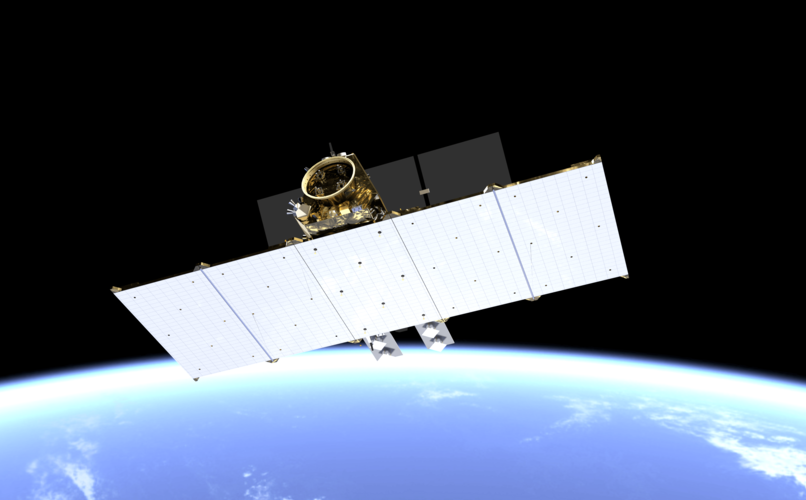
ESA and Thales Alenia Space have today signed a contract to develop the new high-priority Copernicus Radar Observation System for Europe in L-band (ROSE-L) environmental monitoring mission – as part of Europe’s Copernicus programme. The contract was signed in the presence of Riccardo Fraccaro, Undersecretary of the Italian Prime Minister’s Office, and ESA’s Director General, Jan Wörner.
ESA paves the way for first Earth observation Scout mission
3.12.2020 11:30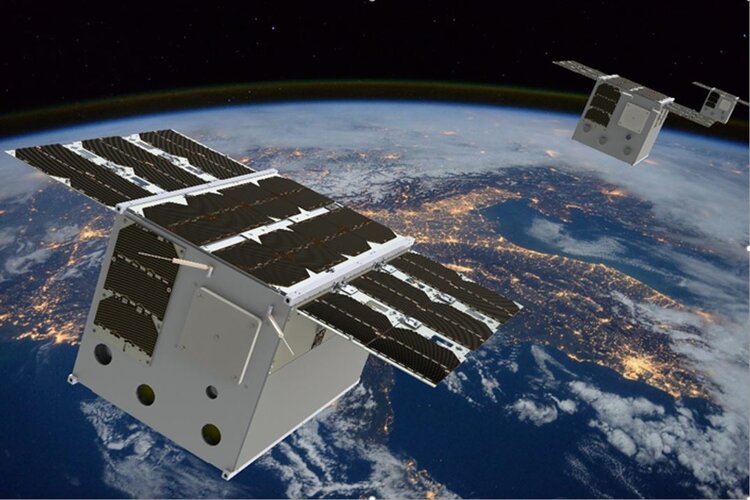
As part of its approach of embracing the concept of New Space through the FutureEO programme, ESA has selected one of four proposals as the first ‘Scout’ mission. This decision paves the way to starting negotiations with GomSpace in Denmark who will lead industrial consortium for the development of a small-satellite mission called Earth System Processes Monitored in the Atmosphere by a Constellation of CubeSats, or EPS–MACCS for short.
Copernicus satellites keep eyes on icebergs for Vendée Globe
2.12.2020 16:00
On 8 November, 33 intrepid sailors set off from Les Sables-D’Olonne in western France to take part in the most extreme, solo, non-stop, race around the world: the Vendée Globe. The route of around 45 000 km takes them down through the Atlantic and into the heart of the Southern Ocean – which is where they are heading now. Thanks to information from satellites, an ice exclusion zone has been established to help keep sailors away from icebergs. For extra safety, satellite images and data are being used to map any ice around Antarctica before the sailors pass through.
Copernicus satellites keep eyes on icebergs for Vendée Globe
2.12.2020 16:00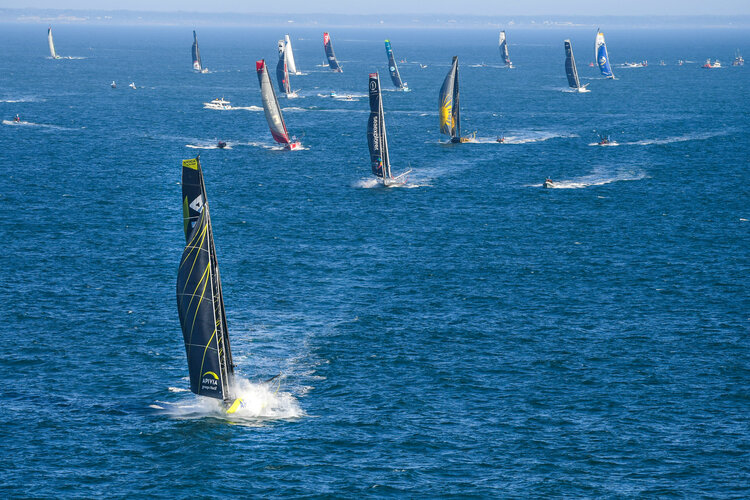
On 8 November, 33 intrepid sailors set off from Les Sables-D’Olonne in western France to take part in the most extreme, solo, non-stop, race around the world: the Vendée Globe. The route of around 45 000 km takes them down through the Atlantic and into the heart of the Southern Ocean – which is where they are heading now. Thanks to information from satellites, an ice exclusion zone has been established to help keep sailors away from icebergs. For extra safety, satellite images and data are being used to map any ice around Antarctica before the sailors pass through.
A-68A on the move
1.12.2020 17:00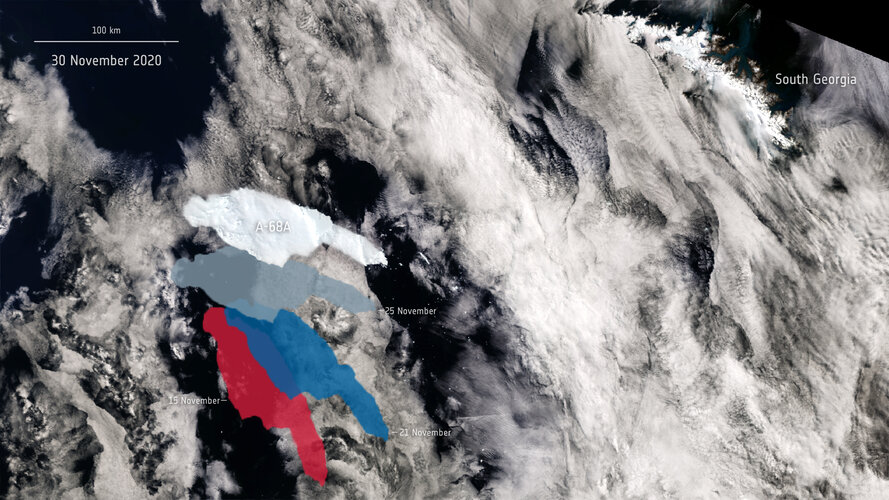 Image:
All eyes remain on the giant A-68A iceberg on its journey across the Southern Ocean. This image shows A-68A’s movements over the past 15 days using data from the Copernicus Sentinel-1 and Sentinel-3 missions.
Earth from Space: Kiruna
27.11.2020 10:00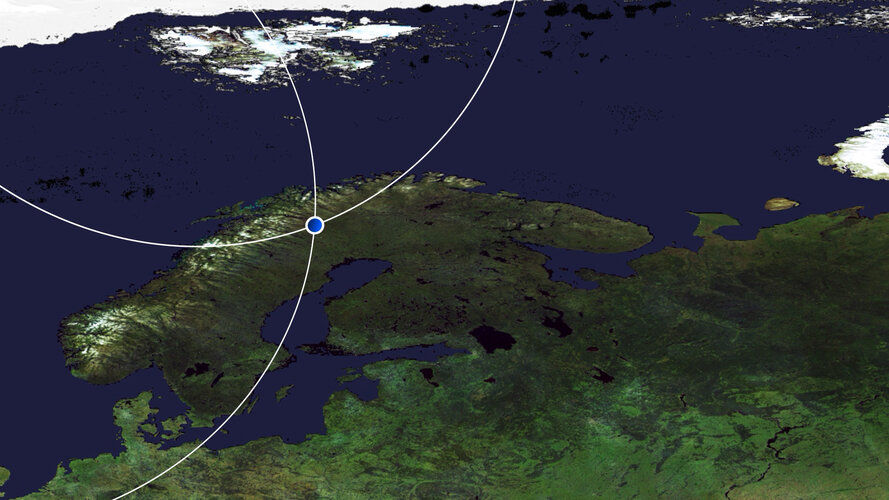 Video:
00:03:27
In this week's edition of the Earth from Space programme, the Copernicus Sentinel-2 mission takes us over Kiruna, the northernmost town in Sweden.
See also Kiruna, Sweden to download the image.
Kiruna, Sweden
27.11.2020 10:00 Image:
Kiruna, the northernmost town in Sweden, is featured in this snowy image captured by the Copernicus Sentinel-2 mission.
Iceberg A-68A: hit or miss?
26.11.2020 17:00 Image:
An enormous iceberg, called A-68A, has made headlines over the past weeks as it drifts towards South Georgia in the Southern Ocean. New images show the berg is rotating and potentially drifting westwards.
Iceberg A-68A: hit or miss?
26.11.2020 17:00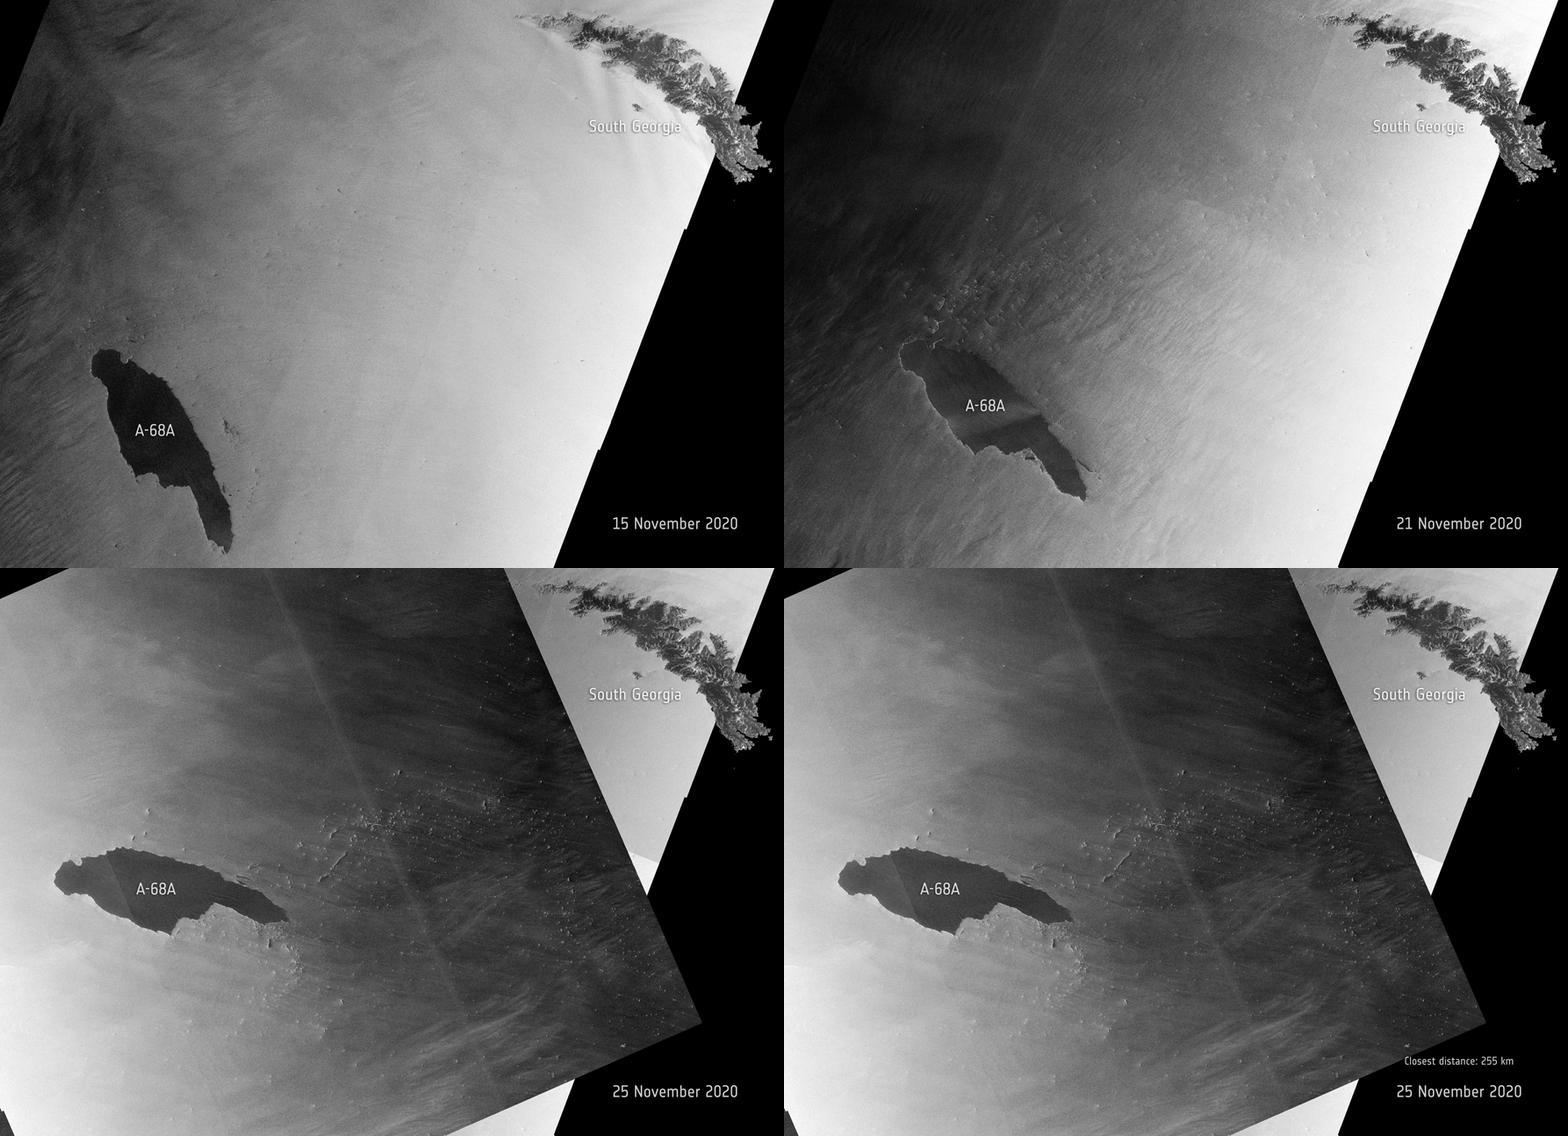 Image:
An enormous iceberg, called A-68A, has made headlines over the past weeks as it drifts towards South Georgia in the Southern Ocean. New images show the berg is rotating and potentially drifting westwards.
Over to you, Eumetsat!
24.11.2020 15:27
It was a spectacular launch on 21 November, as the Copernicus Sentinel-6 Michael Freilich satellite was lifted into space on a SpaceX Falcon 9 rocket. After taking care of the Earth observation spacecraft during the critical early days and making it at home in its new environment, ESA is ready to hand over control to Eumetsat.
Highlights from the Sentinel-6 launch
23.11.2020 17:30 Video:
00:01:20
Relive key moments of the launch of the Copernicus Sentinel-6 Michael Freilich satellite. The spacecraft lifted off on 21 November on a Falcon 9 rocket from the Vandenberg Air Force Base, California, US.
The satellite will continue the long-term record of reference measurements, extending the record of sea-level height into a fourth decade. Orbiting at an altitude of over 1300 km and reaching 66°N and 66°S, Sentinel-6 provides measurements to map the height of the sea surface over 95% of the world’s ice-free oceans every 10 days.
While Sentinel-6 is one of the European Union’s family of Copernicus missions, its implementation is the result of a unique cooperation between the European Commission ESA, Eumetsat, NASA and NOAA, with contribution from the CNES French space agency.
Read more about the Copernicus Sentinel-6 mission.
Revisit the Copernicus Sentinel-6 Michael Freilich launch
21.11.2020 20:30 Video:
00:00:00
Watch the replay of the full Copernicus Sentinel-6 Michael Freilich launch coverage. This new satellite lifted off on 21 November a Falcon 9 rocket from the Vandenberg Air Force Base, California, US.
Copernicus Sentinel-6 Michael Freilich is the first of two identical satellites to provide critical measurements of sea-level change. This latest Copernicus satellite will continue the long-term record of reference measurements, extending the record of sea-level height into a fourth decade. The launch coverage includes the all-important liftoff and acquisition of signal as well as discussions with experts and partners in the mission, as well as data users. The Copernicus Sentinel-6 mission is a true example of international cooperation. While Sentinel-6 is one of the European Union’s family of Copernicus missions, its implementation is the result of the unique collaboration between ESA, NASA, Eumetsat and NOAA, with contribution from the French space agency CNES
New Copernicus satellite to monitor sea-level rise launched
21.11.2020 19:49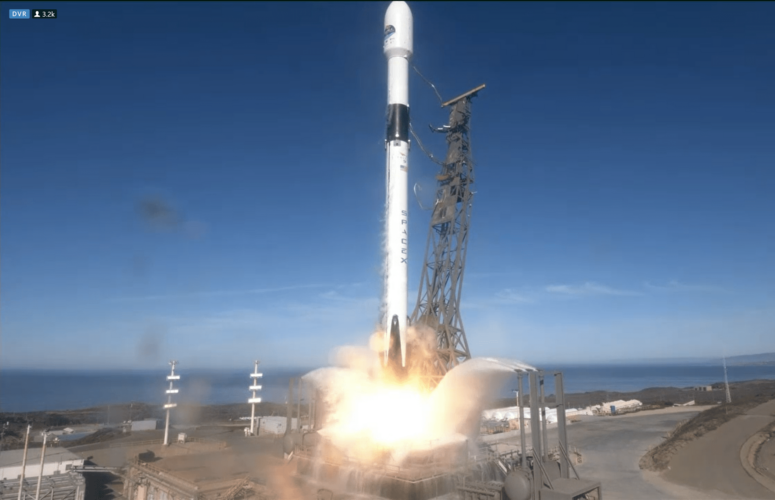
The Copernicus Sentinel-6 Michael Freilich satellite has been launched into orbit around Earth on a SpaceX Falcon 9 rocket. Using the latest radar altimetry technology, this new satellite is set to provide a new overview of ocean topography and advance the long-term record of sea-surface height measurements that began in 1992 – measurements that are essential for climate science, for policy-making and, ultimately, for protecting the lives of millions at risk of sea-level rise.
New Copernicus satellite to monitor sea-level rise launched
21.11.2020 19:49
The Copernicus Sentinel-6 Michael Freilich satellite has been launched into orbit around Earth. Using the latest radar altimetry technology, this new satellite is set to provide a new overview of ocean topography and advance the long-term record of sea-surface height measurements that began in 1992 – measurements that are essential for climate science, for policy-making and, ultimately, for protecting the lives of millions at risk of sea-level rise.
New Copernicus satellite to monitor sea-level rise launched
21.11.2020 19:49
The Copernicus Sentinel-6 Michael Freilich satellite has been launched into orbit around Earth. Using the latest radar altimetry technology, this new satellite is set to provide a new overview of ocean topography and advance the long-term record of sea-surface height measurements that began in 1992 – measurements that are essential for climate science, for policy-making and, ultimately, for protecting the lives of millions at risk of sea-level rise.
Copernicus Sentinel-6 Michael Freilich liftoff replay
21.11.2020 19:30 Video:
00:02:00
Watch the replay of Copernicus Sentinel-6 Michael Freilich lifting off from the Vandenberg Air Force Base, California, US, on 21 November 2020. Copernicus Sentinel-6 Michael Freilich is the first of two identical satellites to provide critical measurements of sea-level change. This latest Copernicus satellite will continue the long-term record of reference measurements, extending the record of sea-level height into a fourth decade. Mapping 95% of Earth’s ice-free ocean every 10 days, it will also provide crucial operational data for ocean forecasting.
The Copernicus Sentinel-6 mission is a true example of international cooperation. While Sentinel-6 is one of the European Union’s family of Copernicus missions, its implementation is the result of the unique collaboration between ESA, NASA, Eumetsat and NOAA, with contribution from the French space agency CNES.
Read more about the Copernicus Sentinel-6 mission.
Copernicus Sentinel-6 lifts off
21.11.2020 18:30 Image:
The Copernicus Sentinel-6 Michael Freilich satellite lifts off on a Falcon 9 rocket from the Space Launch Complex at the Vandenberg Air Force Base, California, US.
Copernicus Sentinel-6 lifts off
21.11.2020 18:30 Image:
The Copernicus Sentinel-6 Michael Freilich satellite lifts off on a Falcon 9 rocket from the Space Launch Complex at the Vandenberg Air Force Base, California, US.
Sea-level monitoring satellite in position for liftoff
21.11.2020 11:48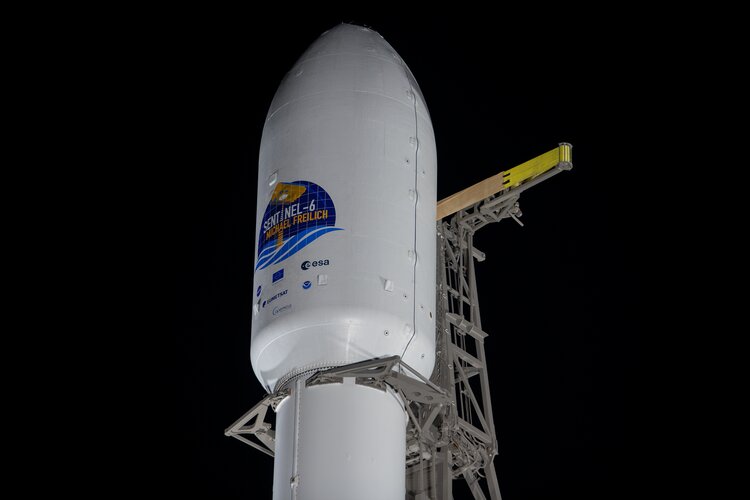
With liftoff set for today at 17:17 GMT (18:17 CET, 09:17 PST), the Copernicus Sentinel-6 Michael Freilich satellite is poised for liftoff – atop a Falcon 9 rocket on the launch pad at the Vandenberg Air Force Base in California, US.
Mission control ready for Sentinel liftoff
20.11.2020 11:56 Image:
After countless simulations and a dress rehearsal, ESA's flight control team are ready for liftoff
Team talk: 10 things about Copernicus Sentinel-6
20.11.2020 11:50
On Saturday 21 November, the Copernicus Sentinel-6 Michael Freilich satellite will launch from the Vandenberg Air Force Base in California, US. Learn more about how the satellite will measure sea-surface height with greater precision than ever before through this series of soundbites from ESA experts and spokespeople.
Vandenberg Air Force Base, California
20.11.2020 10:00 Image:
This Copernicus Sentinel-2 image features the Vandenberg Air Force Base, in California, where the Copernicus Sentinel-6 Michael Freilich satellite will soon launch from.
Earth from Space: Vandenberg Air Force Base, California
20.11.2020 10:00 Video:
00:03:23
In this week's edition of the Earth from Space programme, Copernicus Sentinel-2 takes us over the Vandenberg Air Force Base, in California, US, where the Copernicus Sentinel-6 Michael Freilich satellite will soon launch from.
See also Vandenberg Air Force Base, California to download the image.
Learn about sea-level rise and Copernicus Sentinel-6
19.11.2020 11:30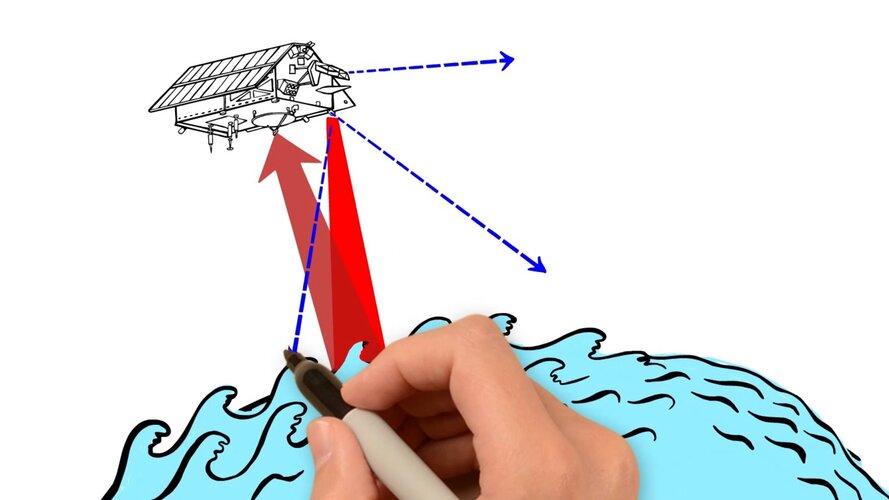 Video:
00:03:44
Learn how climate change is causing our seas to rise and how satellites have been measuring the height of the sea surface systematically since 1992. With global sea level now rising fast, Copernicus Sentinel-6 Michael Freilich picks up the baton as the latest satellite mission to extend the legacy of sea-surface height measurements. Learn how it makes these critical measurements.
Watch live: Copernicus Sentinel-6 Michael Freilich launch
18.11.2020 12:18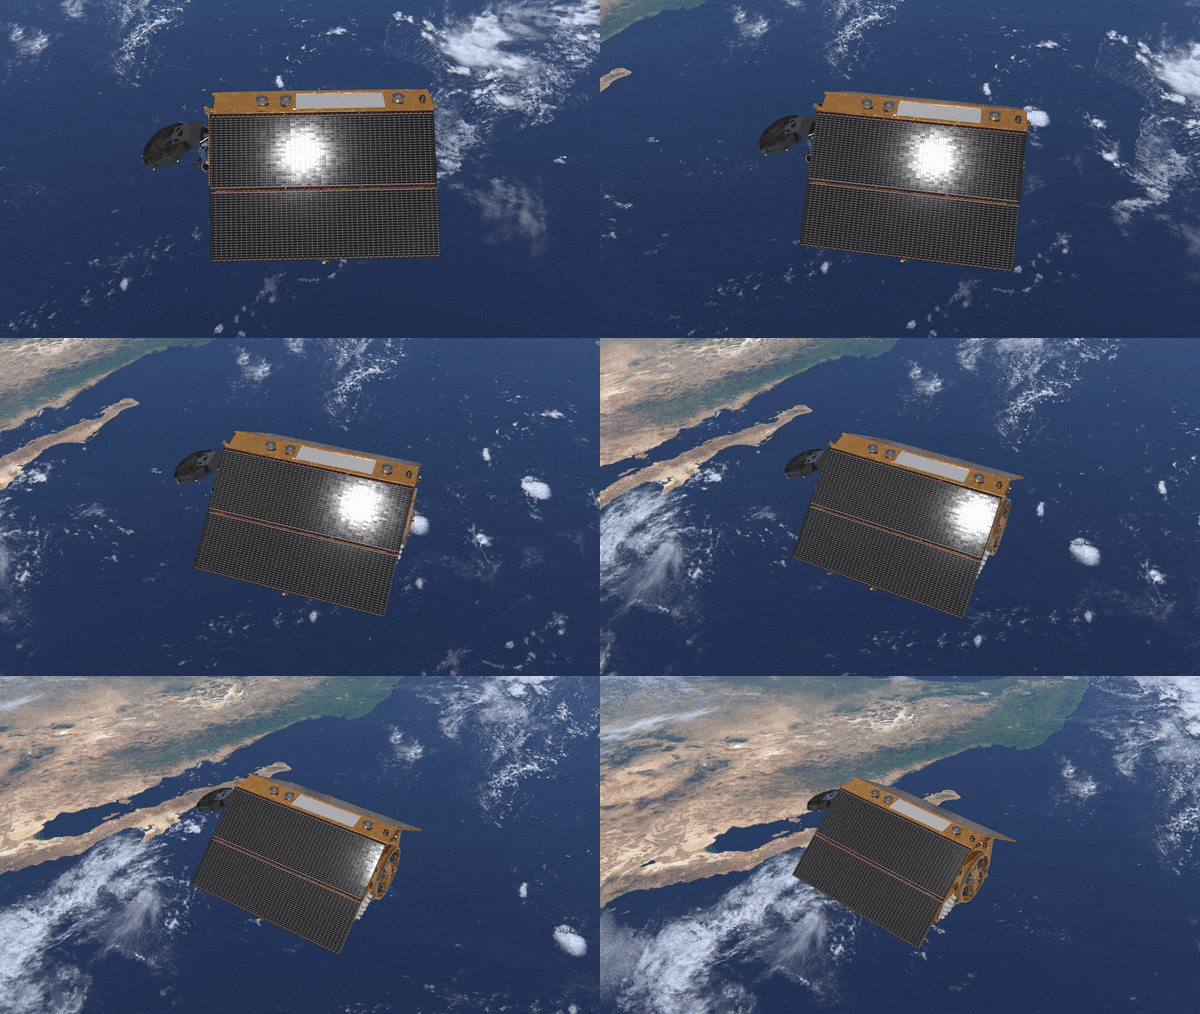
Watch the launch of the Copernicus Sentinel-6 Michael Freilich ocean-monitoring satellite on ESA Web TV on Saturday 21 November from 17:45 CET (08:45 PST).
Watch live: Copernicus Sentinel-6 Michael Freilich launch
18.11.2020 12:18
Watch the launch of the Copernicus Sentinel-6 Michael Freilich ocean-monitoring satellite on ESA Web TV on Saturday 21 November from 17:45 CET (08:45 PST).
Vega flight VV17 failure: Arianespace and ESA appoint an independent Inquiry Commission
17.11.2020 18:21Press Release N° 23–2020
On Tuesday 17 November, Arianespace announced the loss of the Vega VV17 mission, carrying two payloads: SEOSAT-Ingenio for ESA and TARANIS for the French space agency, CNES.
Watch live: Launch of the next Earth-observing satellite SEOSAT-Ingenio
16.11.2020 13:50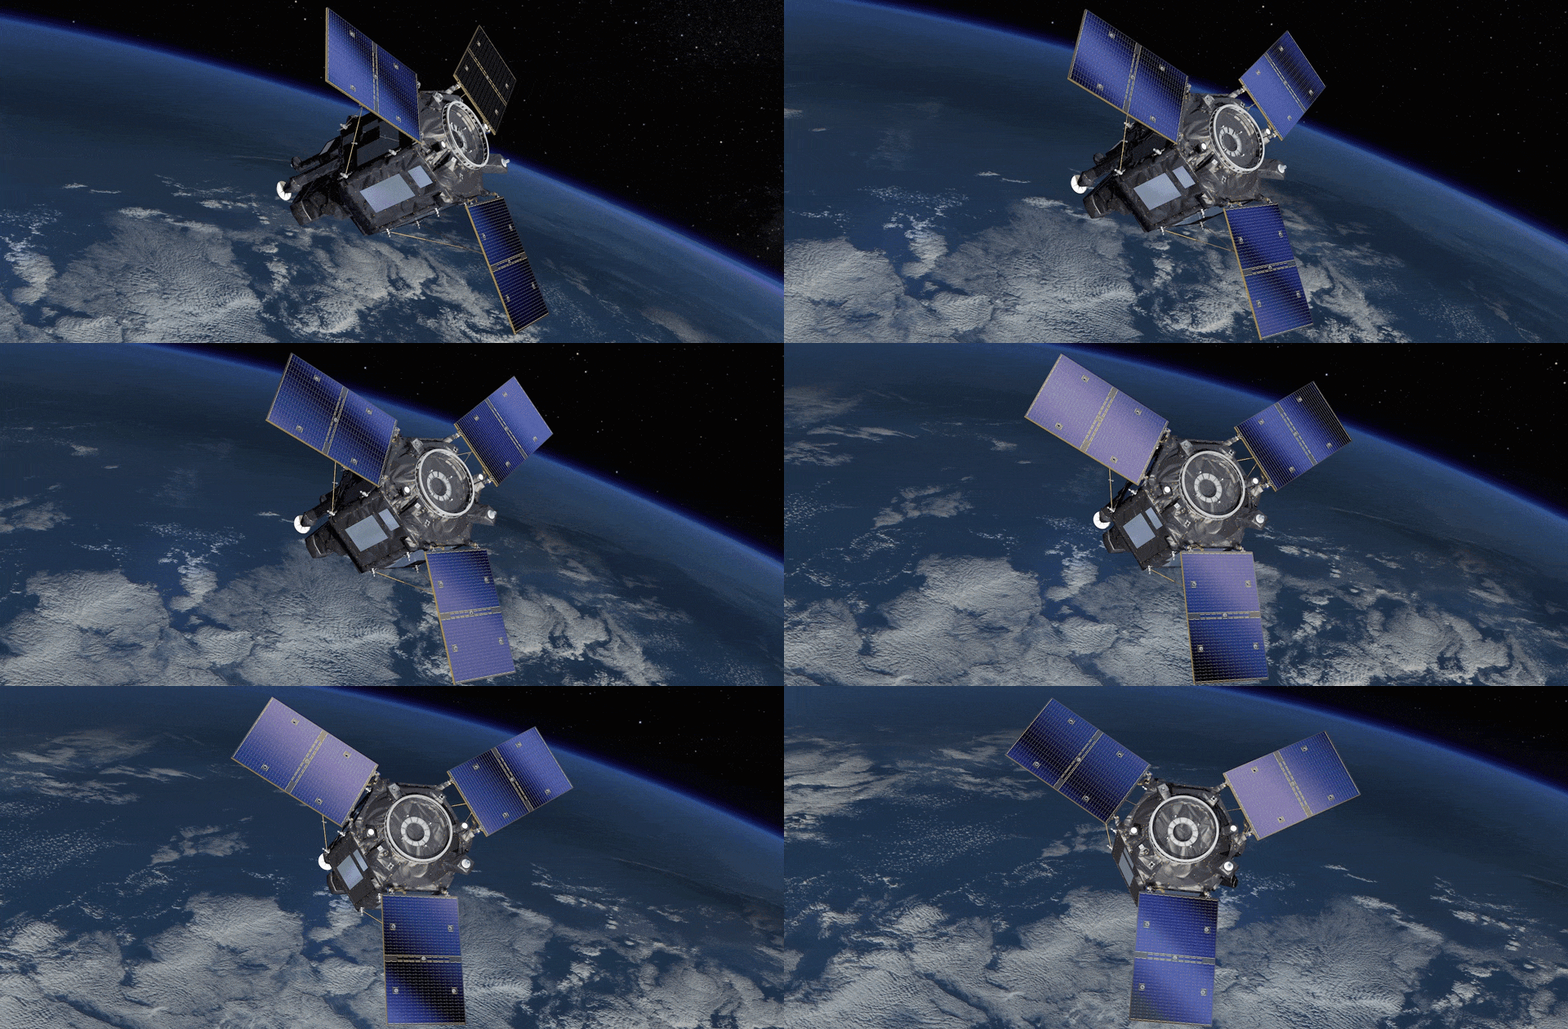
Watch the launch of SEOSAT-Ingenio, the Spanish high-resolution land imaging mission, on ESA Web TV on Tuesday 17 November from 02:30 CET (16 November 22:30 local time in Kourou).
Watch live: Launch of the next Earth-observing satellite SEOSAT-Ingenio
16.11.2020 13:50
Watch the launch of SEOSAT-Ingenio, the Spanish high-resolution land imaging mission, on ESA Web TV on Tuesday 17 November from 02:30 CET (16 November 22:30 local time in Kourou).
Watch live: Launch of the next Earth-observing satellite SEOSAT-Ingenio
16.11.2020 13:50
Update: Trajectory degraded on VV17 after first ignition of the Avum engine. Investigations on the anomaly ongoing. More to come shortly.
Watch the launch of SEOSAT-Ingenio, the Spanish high-resolution land imaging mission, on ESA Web TV on Tuesday 17 November from 02:30 CET (16 November 22:30 local time in Kourou).
Contracts signed for three high-priority environmental missions
13.11.2020 17:30
Today, ESA signed contracts with Thales Alenia Space in France and in Italy, and Airbus in Spain to build three of the new high-priority Copernicus satellite missions: CHIME, CIMR and LSTM, respectively. Each mission is set to help address different major environmental challenges such as sustainable agriculture management, food security, the monitoring of polar ice supporting the EU Integrated Policy for the Arctic, and all will be used to understand climate change.
Preparing to fly an Earth-observing genius
13.11.2020 10:37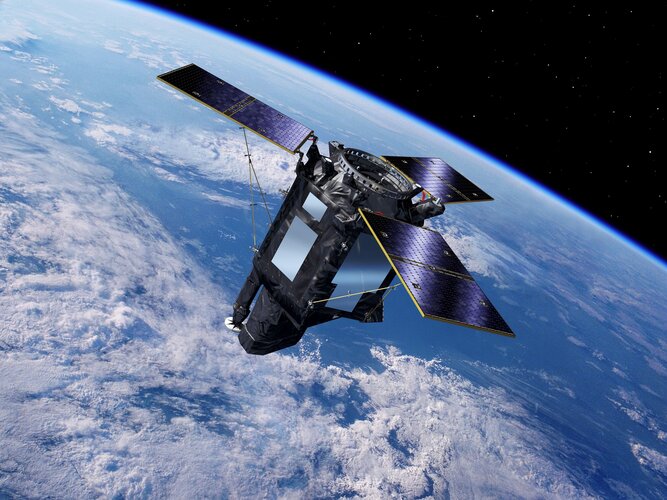
Teams at ESA's mission control centre are getting ready to ensure a new Earth observation mission safely begins its life in space. The SEOSAT-Ingenio mission will provide high-resolution images of Earth’s surface, providing crucial data to better understand our environment and for land, water and risk management and security.
Darmstadt, Germany
13.11.2020 10:00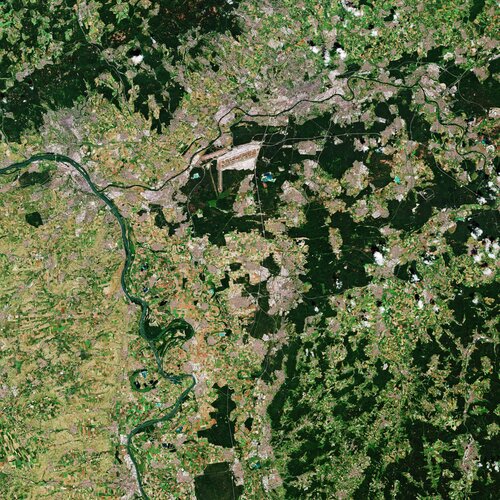 Image:
The Copernicus Sentinel-2 mission takes us over Darmstadt – home to ESA’s European Space Operations Centre.
Earth from Space: Darmstadt
13.11.2020 10:00 Video:
00:03:56
In this week's edition of the Earth from Space programme, the Copernicus Sentinel-2 mission takes us over Darmstadt, Germany, home to ESA’s European Space Operations Centre,
See also Darmstadt, Germany to download the image.
SEOSAT-Ingenio hoisted into launch tower
13.11.2020 9:05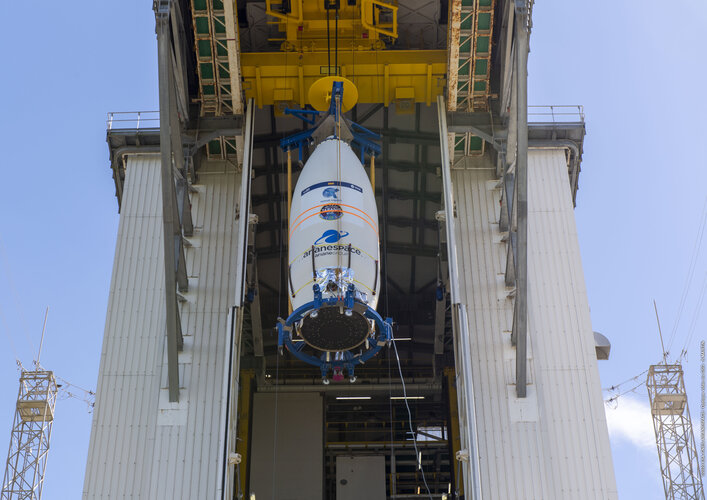
Ahead of its liftoff, scheduled for on Tuesday 17 November 2020 at 02:52 CET (16 November 22:52 local time in Kourou), the SEOSAT-Ingenio satellite sealed in the rocket fairing has been hoisted into the Vega launch tower at Europe’s Spaceport in Kourou, French Guiana.
SEOSAT-Ingenio hoisted into launch tower
13.11.2020 9:05
Ahead of its liftoff, scheduled on Tuesday 17 November 2020 at 02:52 CET (16 November 22:52 local time in Kourou), the SEOSAT-Ingenio satellite sealed in the rocket fairing has been hoisted into the Vega launch tower at Europe’s Spaceport in Kourou, French Guiana.
Sentinel data enables new system for agricultural monitoring in Poland
12.11.2020 14:00
Data from the Copernicus Sentinel satellites are enabling the national monitoring of agricultural activity in Poland – a colossal task that will support the efforts of key national agencies to assess a country’s cropland, productivity, and food security, as well as the implementation of the EU Common Agricultural Policy in years to come.
Coastal observations boosted by new reference satellite
12.11.2020 10:15
As global temperatures continue to rise, coastal areas will increasingly bear the brunt of storm surges and more frequent, intense weather events. Sea level is rising at 3.6 centimetres per decade and this trend is accelerating, compounding the threats faced by coastal communities: with every centimetre another three million people are put at risk of annual coastal flooding. Scheduled to be launched on 21 November, the Copernicus Sentinel-6 Michael Freilich satellite is set to continue the long-term record of sea-level measurements that are needed for protect our coasts.
Copernicus Sentinel-6 ready for launch
11.11.2020 14:00 Video:
00:03:00
Final preparations are underway in California for the launch of Sentinel-6 Michael Freilich, a joint European and US satellite designed to take precise measurements of sea-level change. The satellite forms part of the European Union’s Copernicus Earth Observation programme and will employ a radar altimeter to map sea-surface topography. The satellite will provide fundamental data for climate science and policymaking, helping to protect the 600 million people who live in vulnerable coastal areas. It will also deliver near-realtime information for marine and weather forecasts.
The mission is a collaboration between ESA, the European Commission, EUMETSAT, NASA and NOAA, with support from the French space agency CNES. Scheduled for launch on 21 November on a SpaceX Falcon 9 rocket from the Vandenberg Air Force Base on the California coast, the satellite is named Michael Freilich after NASA’s former Director of Earth Science.
A-roll contains clean room images from Vandenberg and new interviews. B-roll includes clean room, nearby coast and soundbites in English, French and German.
Giant berg on collision course with South Georgia
10.11.2020 14:12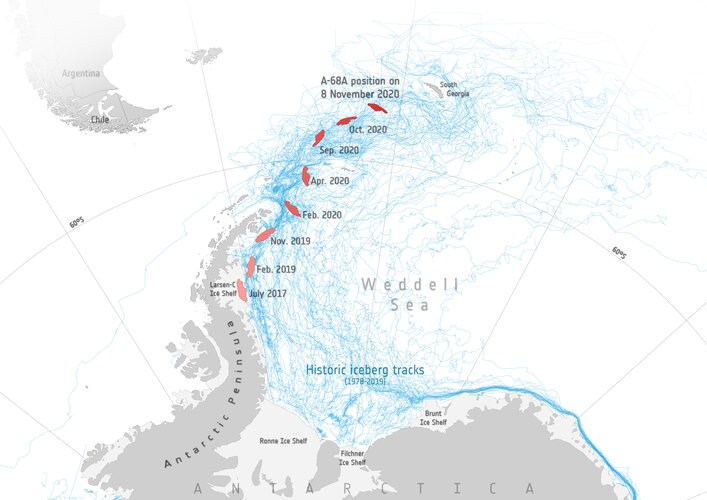 Image:
Giant berg on collision course with South Georgia
SEOSAT-Ingenio sealed from view
10.11.2020 10:30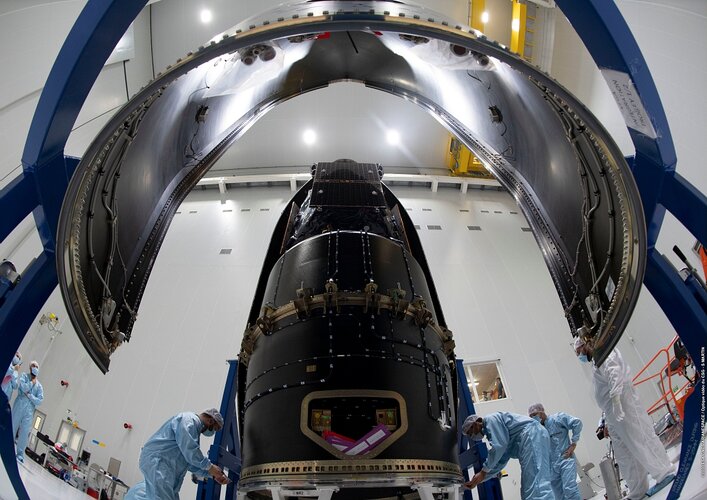
As preparations for the launch of SEOSAT-Ingenio continue on schedule, the team at Europe’s spaceport in Kourou have bid farewell to the satellite as it was sealed inside the rocket fairing over the weekend. The spacecraft is currently scheduled to launch on the evening of Monday 16 November/morning of Tuesday 17 November.
SEOSAT-Ingenio sealed from view
10.11.2020 10:30
As preparations for the launch of SEOSAT-Ingenio continue on schedule, the team at Europe’s spaceport in Kourou have bid farewell to the satellite as it was sealed inside the rocket fairing. The spacecraft is currently scheduled to launch on the evening of Monday 16 November/morning of Tuesday 17 November.
Detecting pollution from individual ships from space
9.11.2020 9:15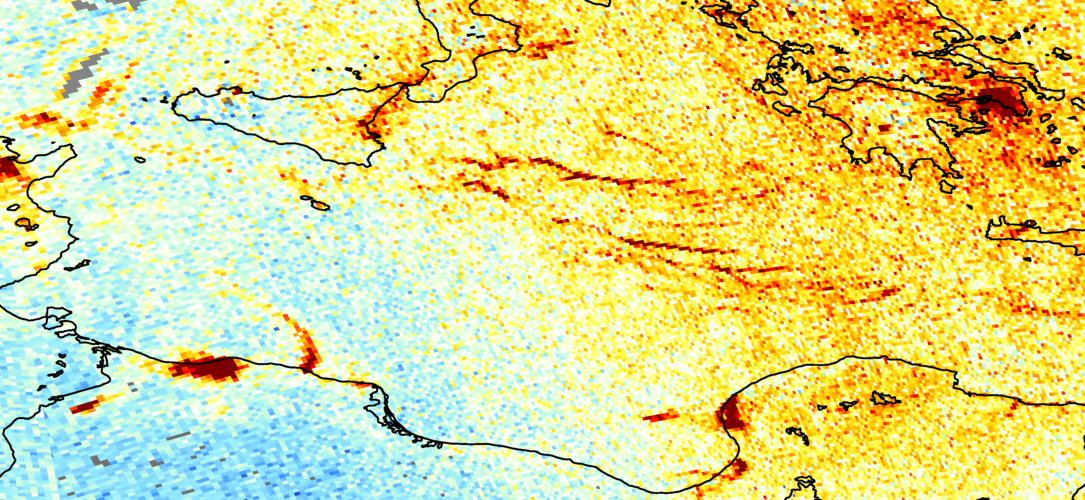
For the first time, scientists, using data from the Copernicus Sentinel-5P satellite, are now able to detect nitrogen dioxide plumes from individual ships from space.
Copernicus Sentinel-6 sealed in rocket fairing
6.11.2020 11:20
As preparations for the launch of Copernicus Sentinel-6 Michael Freilich continue, the team at the Vandenberg Air Force Base in California has bid farewell to the satellite as it is sealed from view within the two half-shells of its Falcon 9 rocket fairing. Liftoff is now set for 21 November at 17:17 GMT (18:17 CET; 09:17 PST).
Crete, Greece
6.11.2020 10:00 Image:
Greece’s largest and most populous island, Crete, is featured in this image captured by the Copernicus Sentinel-1 mission.
Earth from Space: Crete
6.11.2020 10:00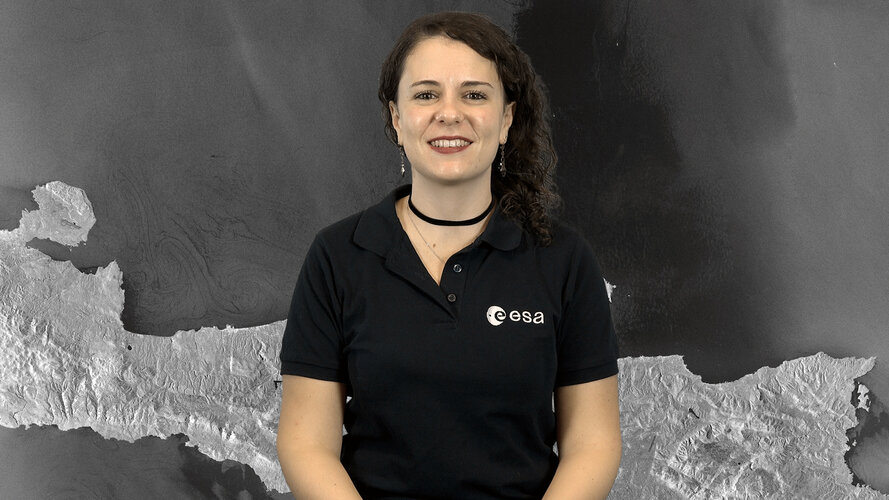 Video:
00:04:26
In this week's edition of the Earth from Space programme, the Copernicus Sentinel-1 mission takes us over Crete, Greece’s largest and most populous island.
See also Crete, Greece to download the image.
Elévation du niveau de la mer et Copernicus Sentinel-6
3.11.2020 17:00 Video:
00:01:10
En amont du lancement imminent du satellite Copernicus EU Sentinel-6 Michael Freilich, rejoignez nos experts pour une discussion en direct à propos de la technologie spatiale qui mesure l’élévation du niveau de la mer et de la manière dont elle contribue à notre compréhension du changement climatique à l’échelle mondiale. Non seulement le niveau de la mer s’élève ces dernières années, mais il s’élève à un rythme qui s‘accélère, mettant en danger les communautés côtières et de nombreuses mégalopoles. Cette discussion, 3 novembre 16:00 CET, sera modérée par Yves-Louis Desnos de l’ESA, avec à ses côtés Marie-Hélène Rio, scientifique des applications océaniques à l’ESA, Benoit Meyssignac, scientifique spécialiste des océans et du climat au CNES et au LEGOS, Marion Semblat, présidente de l’association Time for the Ocean, Jean-Christophe Gros, responsable de programme, European Commission, et Estelle Obligis, responsable des applications marines à EUMETSAT.


